(category)Charts & Analysis
Should you buy the dip?Should you buy the dip?
Buying the dip can work. The part that doesn’t make it into the charts is what it asks of you along the way.
Aaryan Sanghavi•
In Christopher Nolan’s The Prestige, two rival magicians spend years trying to outdo each other with the same trick. The audience sees the applause. What it never sees is the price each of them pay in private to pull it off. Investing has its own version of that hidden price, and it’s easy to miss when all anyone sees is the final number.
As of September end 2026, the market, Nifty 500 TRI, is down 6.81% for the year. Dips like this tend to bring out a familiar set of posts on social media. There are charts showing that earlier falls were followed by a 52-week or all-time high soon after. There are tables showing how a sharp fall in certain periods led to a bigger rise over the next. These posts then provide a three word conclusion of their analyses : Buy The Dip (‘BTD’).
The setup:
Honestly, the premise is very enticing. Nobody wants to pay full price for something that’s about to go on sale. The hard part is knowing when the sale is coming and more importantly, pulling it off. We wanted to see if a market timer who followed the rules would be able to perform meaningfully better than someone investing a fixed amount every month.
Our analysis takes inspiration from AQR’s 2025 paper, Hold the Dip, which tested 196 buy-the-dip variants on the S&P 500, from 1965 to 2025. On average, they produced worse risk-adjusted returns than simply holding the index with over 60% having a lower Sharpe Ratio. The paper works with lump sums and Sharpe Ratios. We set out to answer a narrower question : Does buying the dip beat a SIP?
To test it, we compared two high net-worth investors (HNI) on the same stage with the same monthly investment budget. One invests every month no matter what the market is doing. The other holds the investment budget in cash, invests everything accumulated when a dip signal fires, and then waits for a fresh salary before investing again.
Both investors have the same Rs. 1,00,000 a month to invest into the Nifty 500 TRI - one invests and one waits. The SIP investor buys on the first trading day of each month. While the timer waits, their cash is assumed to earn 5% a year, compounded daily. Neither investor borrows or uses leverage. The simulation runs from April 2006 to September 2026, which covers 246 monthly salaries. We compare final wealth, counting any cash the timer hasn’t invested, and compute XIRR for both.
The timer also needs a rule that quantifies a dip. There’s no standard definition, so rather than pick just one, we tested the two most common interpretations of what counts as a dip signal, across a range of settings.
First set of scenarios:
The first interpretation of a dip is to look at a market fall within a specified period of time; i.e. trailing return signals that fire when the market is down X% over the last Y periods. We tested four depths/market-falls (5%, 10%, 15% and 20%) across seven lookbacks (1 week, 2 weeks, 3 weeks, 1 month, 3 months, 6 months and 1 year). That gives 28 rules, ranging from a 5% fall over a year, barely a dip, to a 20% fall in a week, probably a crisis.
To establish the baseline, the SIP investor puts in Rs. 2,46,00,000 over 246 months and ends with Rs. 10,22,25,460, an XIRR of 12.34%. The market timer has to beat this number.
For each timing rule, we look at three numbers. XIRR is the return, Cash drag is the average share of the timer’s money sitting in cash on any given day, which shows how much of it was earning 5% p.a. instead of being invested. The number of deployments counts how often the signal fired. Fewer deployments lead to larger lump sums.
We start with the trailing-return signals. Six of the 28 rules beat the SIP XIRR of 12.34%. In the table below, we have sorted the 28 scenarios in descending order of XIRR.
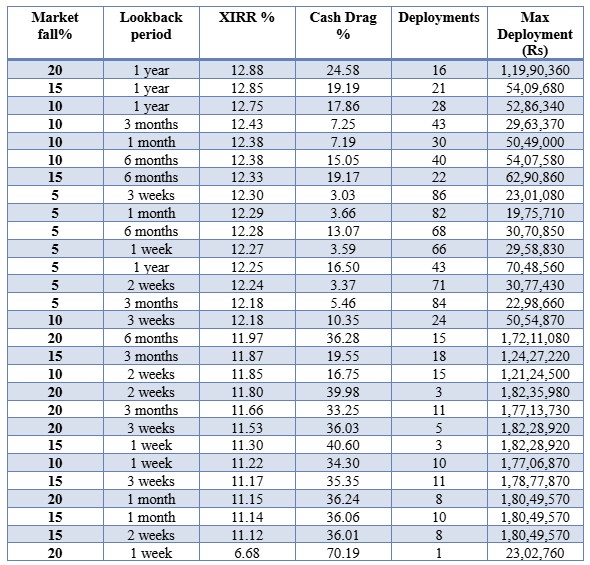
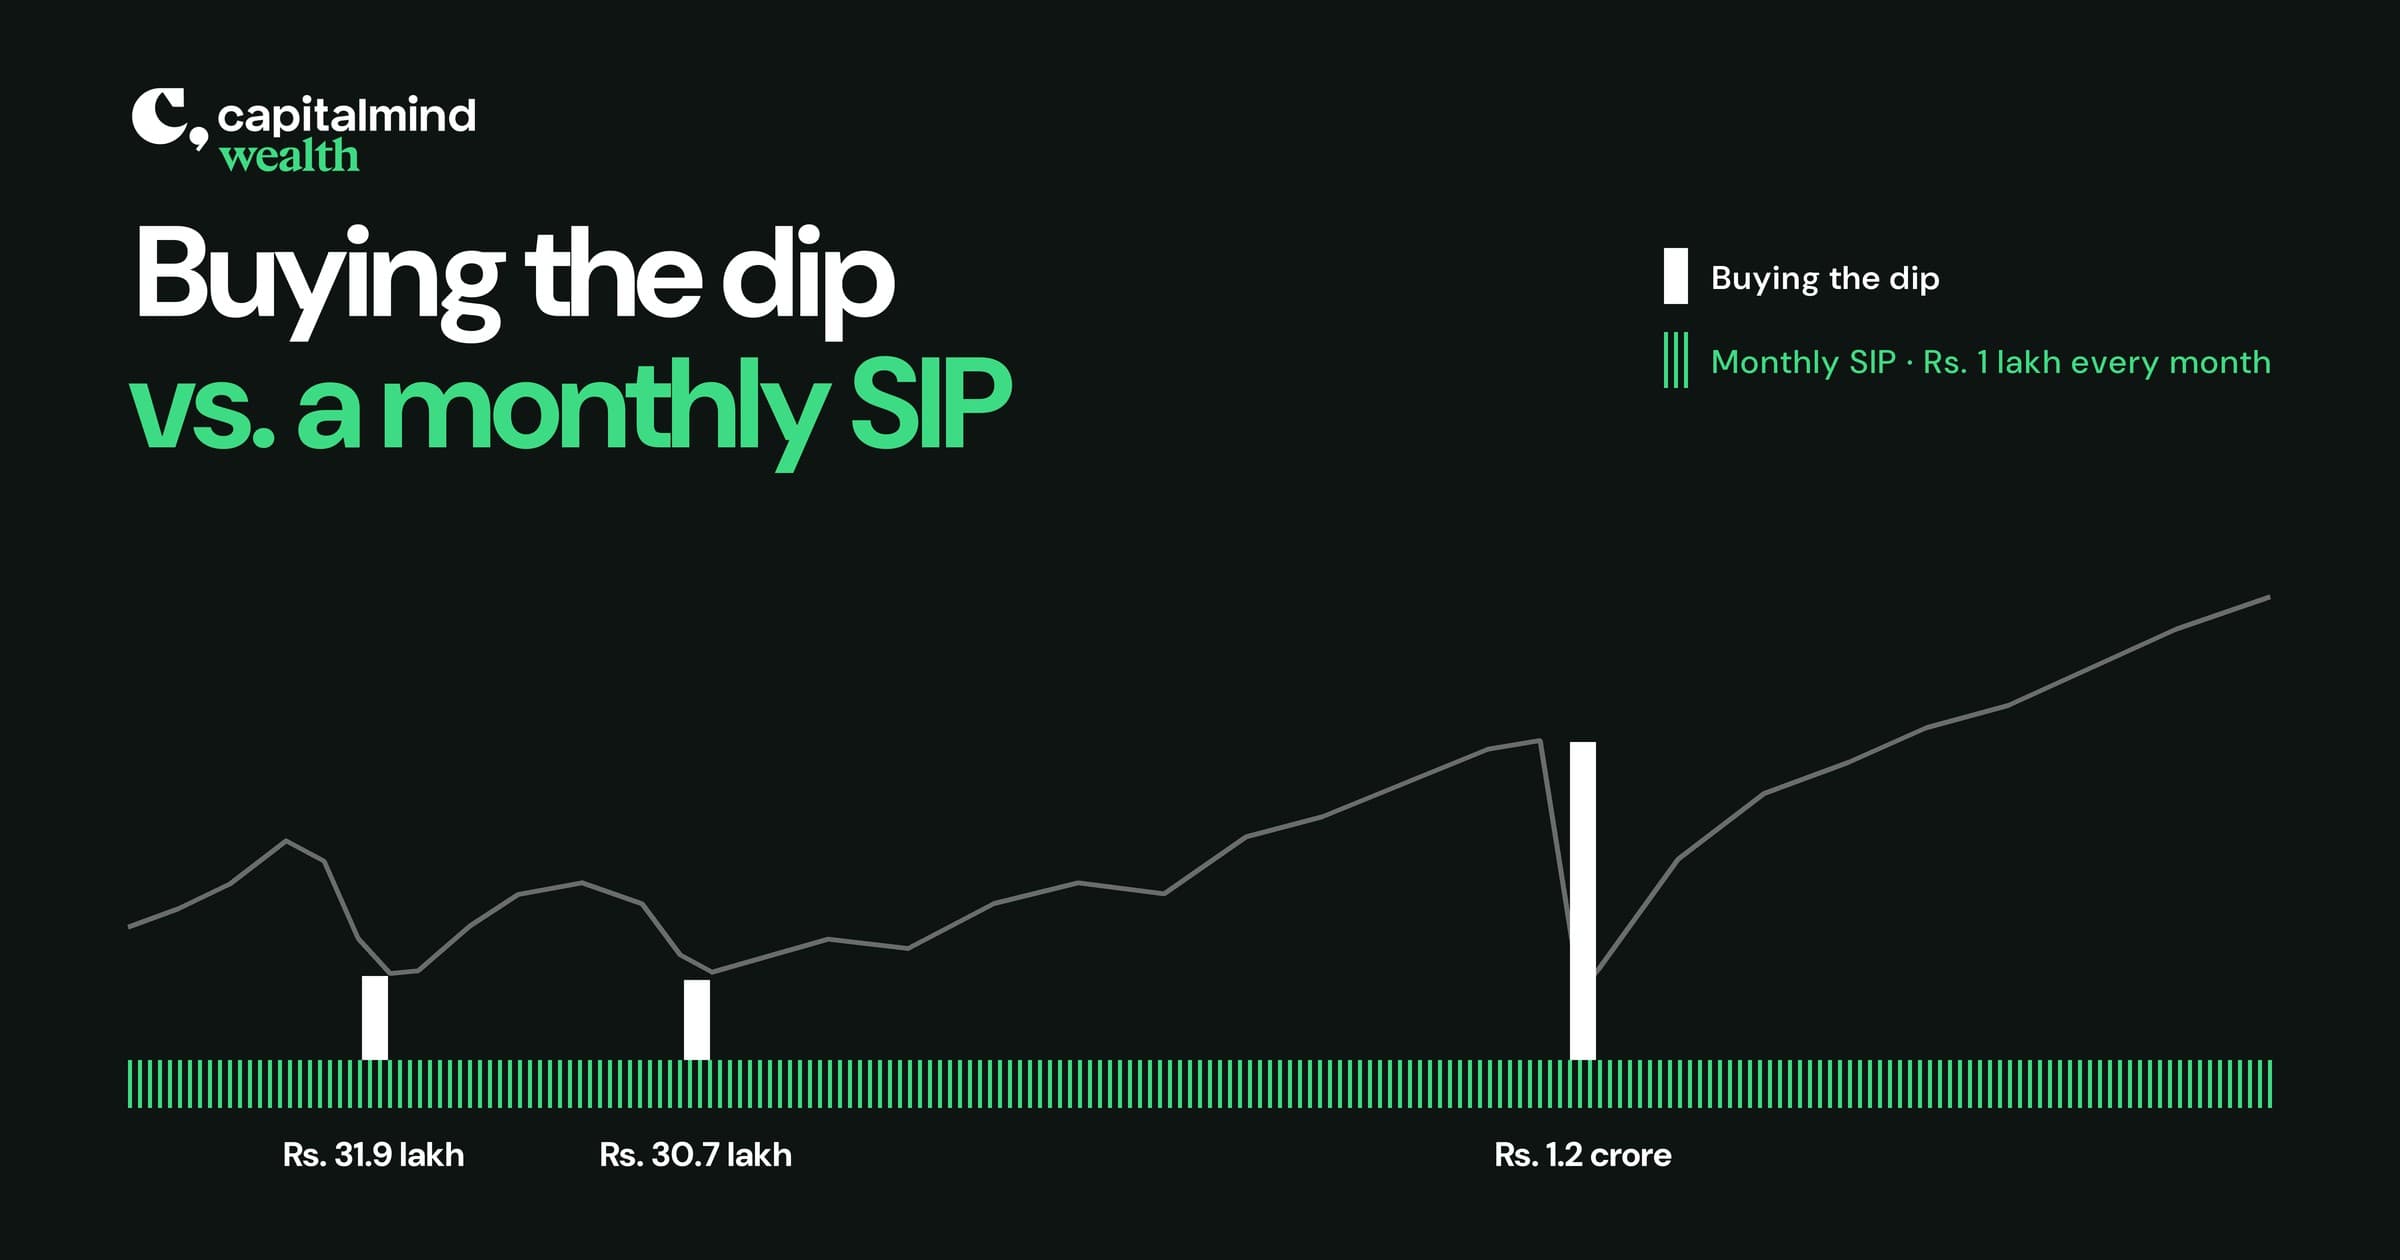
The best of them, a 20% fall over one year, came out ahead by 0.54 percentage points a year. That’s the applause. The question is what the timer paid in private to get it. Its 16 deployments over 20 years were concentrated around three events:
- September 2008, global financial crisis: ~Rs. 32 lakhs got invested. That’s about two and a half years of savings, built up in cash while the market rose from 2006 to 2008. The signal kept firing for the next eight months, so through that stretch the market timer invested monthly alongside the SIP investor.
- October 2011, European debt crisis: ~Rs. 31 lakhs got invested, a little over two years of savings. Three months of monthly deployments followed.
- March 2020, COVID crash: ~Rs. 1.2 crores were invested, a little over eight years of savings with interest.
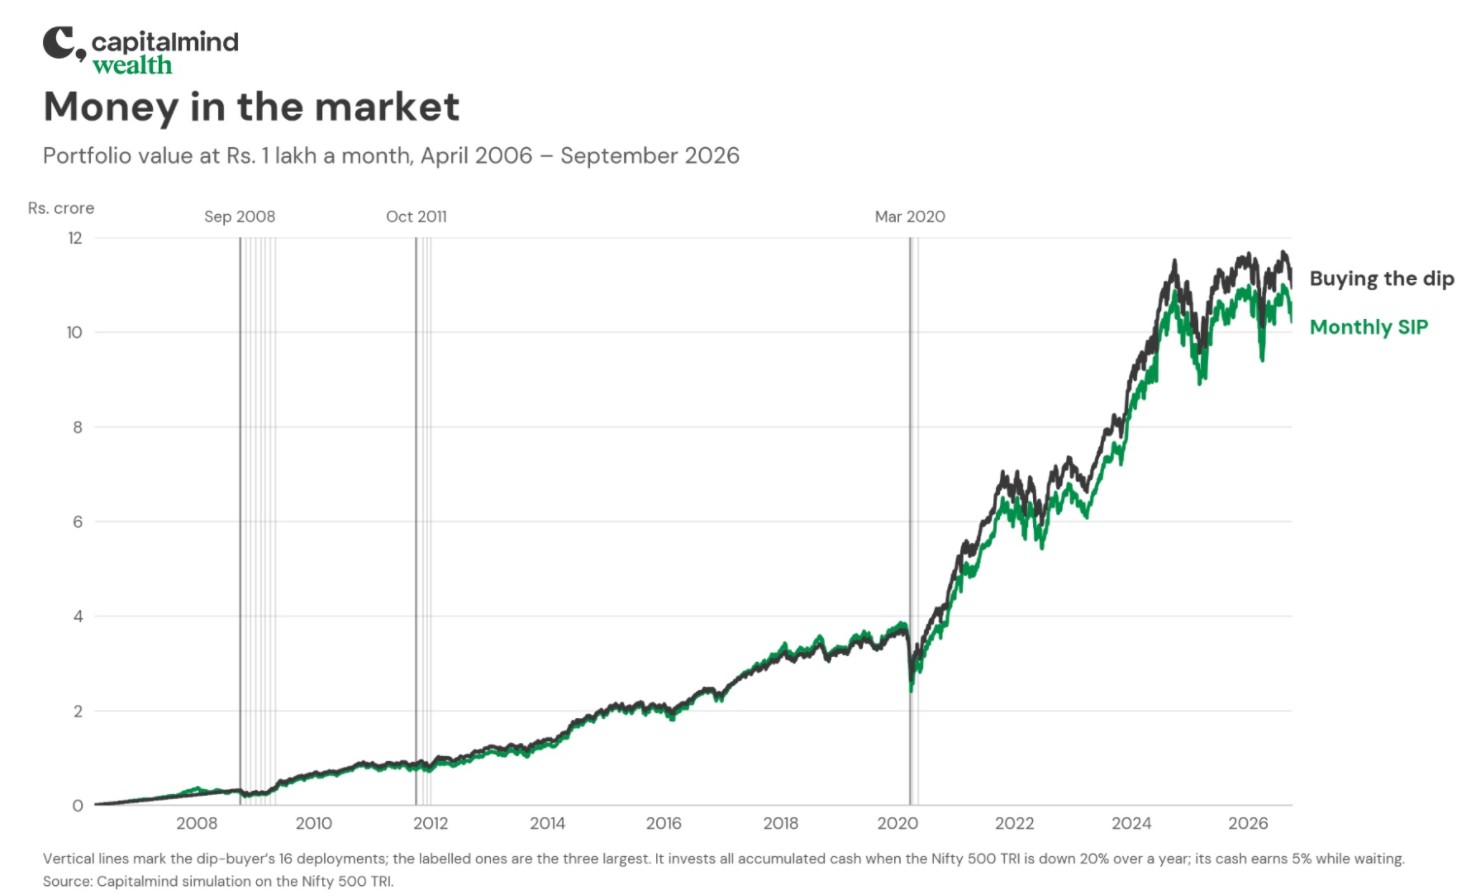
The March 2020 deployment is the one most readers will remember living through. It meant putting about Rs. 1.2 crore, a little over eight years of savings, into equities in one go, while the news was dominated by a global pandemic. Many investors were also unsure about their jobs and businesses at the time, and would have wanted cash on hand for emergencies.
Getting there also meant holding that cash from early 2012 to March 2020 while the market rose, questioning if holding onto the cash was the right decision. The reward for all of it was 0.54 percentage points a year over an investor who simply kept their SIP running.
The worst scenario waits for a 20% fall in a single week. That happened once in 20 years, on 22 January 2008. The timer deployed ~Rs. 23 Lakhs that day and never got another signal. The COVID fall came close, at 18.6% over five trading days, but stopped just short. The timer finished with ~Rs. 5.15 Crores, against the SIP investor’s Rs. 10.2 Crores, about half the wealth.
Second set of scenarios:
The second interpretation of a dip is a fall from recent highs. Drawdown signals fire when the market is X% below its 52-week high. The same four depths/market-falls (5%, 10%, 15%, 20%) from 52 week highs give four more scenarios.
As before, the SIP baseline is an XIRR of 12.34% with 246 deployments.

One scenario in the above table beats the SIP investor, a 10% fall from the 52-week high, ahead by 0.01 percentage points over 89 deployments. That’s close enough to call a tie. The 5% rule deploys nearly every two months out of three and finishes slightly behind. The 15% and 20% rules trail by 0.14 percentage points.
These signals behave differently from the trailing-return ones because they fire far more often. The 5% rule deploys 156 times out of a possible 246, which makes it close to a SIP with extra steps. More frequent signals ease the two problems that made the trailing-return rules hard to follow: the timer isn’t holding years of savings in cash, and isn’t asked to invest a large sum in one go during a crisis. These rules are therefore easier to stick with. There’s less applause, but a much smaller price.
What’s the verdict:
Across both signal types, only 7 of the 32 rules beat the SIP. Without hindsight, an investor starting in 2006 would have had to pick one rule out of 32 and stick with it. Even with the market-fall fixed at 20%, the lookback alone decided the outcome. Over one year of lookback, the rule beat the SIP. Over one week of lookback, it fired once in 20 years and ended with about half the SIP investor’s wealth. In 2006, there was no way to know which way either of them would’ve turned out.
The main reason the timing rules struggle is cash drag. Money waiting for the next fall earns 5% p.a. while the index compounds, and buying cheaply doesn’t help much if not enough gets bought. Even the best rule had nearly a quarter of its money in cash on an average day. Every rule with cash drag above 30% finished below 12%. And the 5% p.a. credited on cash is generous; at savings account rates, every timing rule would look worse.
Which brings us back to The Prestige. Across all 32 scenarios, the best rule’s 0.54 percentage points a year looks like a clean win. What the table doesn’t show is the price paid off stage: picking the right rule in advance, holding cash for eight years while the market rose, and then investing Rs. 1.2 crore in the middle of a pandemic.
The SIP is a trick of its own, and it’s an unusual one: nothing is hidden. Rs. 1,00,000 went in on the first trading day of every month, for 246 months, and compounding did the rest. There was no rule to pick, no signal to wait for and no price paid off stage. It’s so plain it barely feels like a trick at all. Over these 20 years, it beat 25 of the 32 elaborate ones, and the few that beat it by a real margin each asked for some version of the price above.
The trick in markets was never timing. It was time.
Capitalmind Financial Services Private Limited | SEBI Registered Portfolio Manager: INP000005847
Related Posts
 Market Drawdowns: Where We Stand & What History Tells Us in 4 Charts
Anoop Vijaykumar
 Where will the Nifty bottom out?
Krishna Appala
 The Keynesian Beauty Contest: Why expert forecasts often miss the mark
Anoop Vijaykumar
 Inside Japan's 1980s Asset Price Bubble: The Lost Decades
Anoop Vijaykumar
Make your money work as hard as you do.
Talk to a Capitalmind Client AdvisorInvesting is not one size fits all
Learn more about our distinct investment strategies and how they fit into your portfolio.
Learn more about our portfoliosUnlock your wealth potential
Start your journey today