(category)General
Why Does Your Equity Portfolio Need Diversification Across Market Caps?Why Does Your Equity Portfolio Need Diversification Across Market Caps?
Portfolios tilted towards a single market cap are often far more dependent on market conditions than investors realize. We ran 15 years of TRI data across the Nifty 50, Nifty Mid Cap 150, and Nifty Small Cap 250. Read on to see what the numbers actually say.
Sidhanth Paul•

Here's something most investors already know: large caps, mid caps, and small caps behave very differently from each other. Different return profiles, different drawdowns, different rhythms. In any given year, the gap between the best and worst performing cap segment could be as high as ~30%.
Everyone nods along when you say "diversify your market cap exposure." But in practice, most Indian equity portfolios are either tilted toward large caps (because they feel safe) or towards mid and small caps (because someone's cousin made 3x in two years). Neither is wrong, exactly. But both are incomplete in a holistic sense.
Portfolios concentrated in a single segment are often far more dependent on market conditions than investors realize. We ran 15 years of TRI data across the Nifty 50, Nifty Mid Cap 150, and Nifty Small Cap 250 to see what the numbers actually say. The case for owning all three is stronger, and more nuanced, than you think.
What Rs. 100 Turned Into
Let's start with the big picture. Rs. 100 invested in January 2011 in each index:
Nifty 50 TRI: Rs. 468. That's a CAGR of about 10.6%.
Nifty Mid Cap 150 TRI: Rs. 940. CAGR of 15.8%.
Nifty Small Cap 250 TRI: Rs. 642. CAGR of 12.9%.
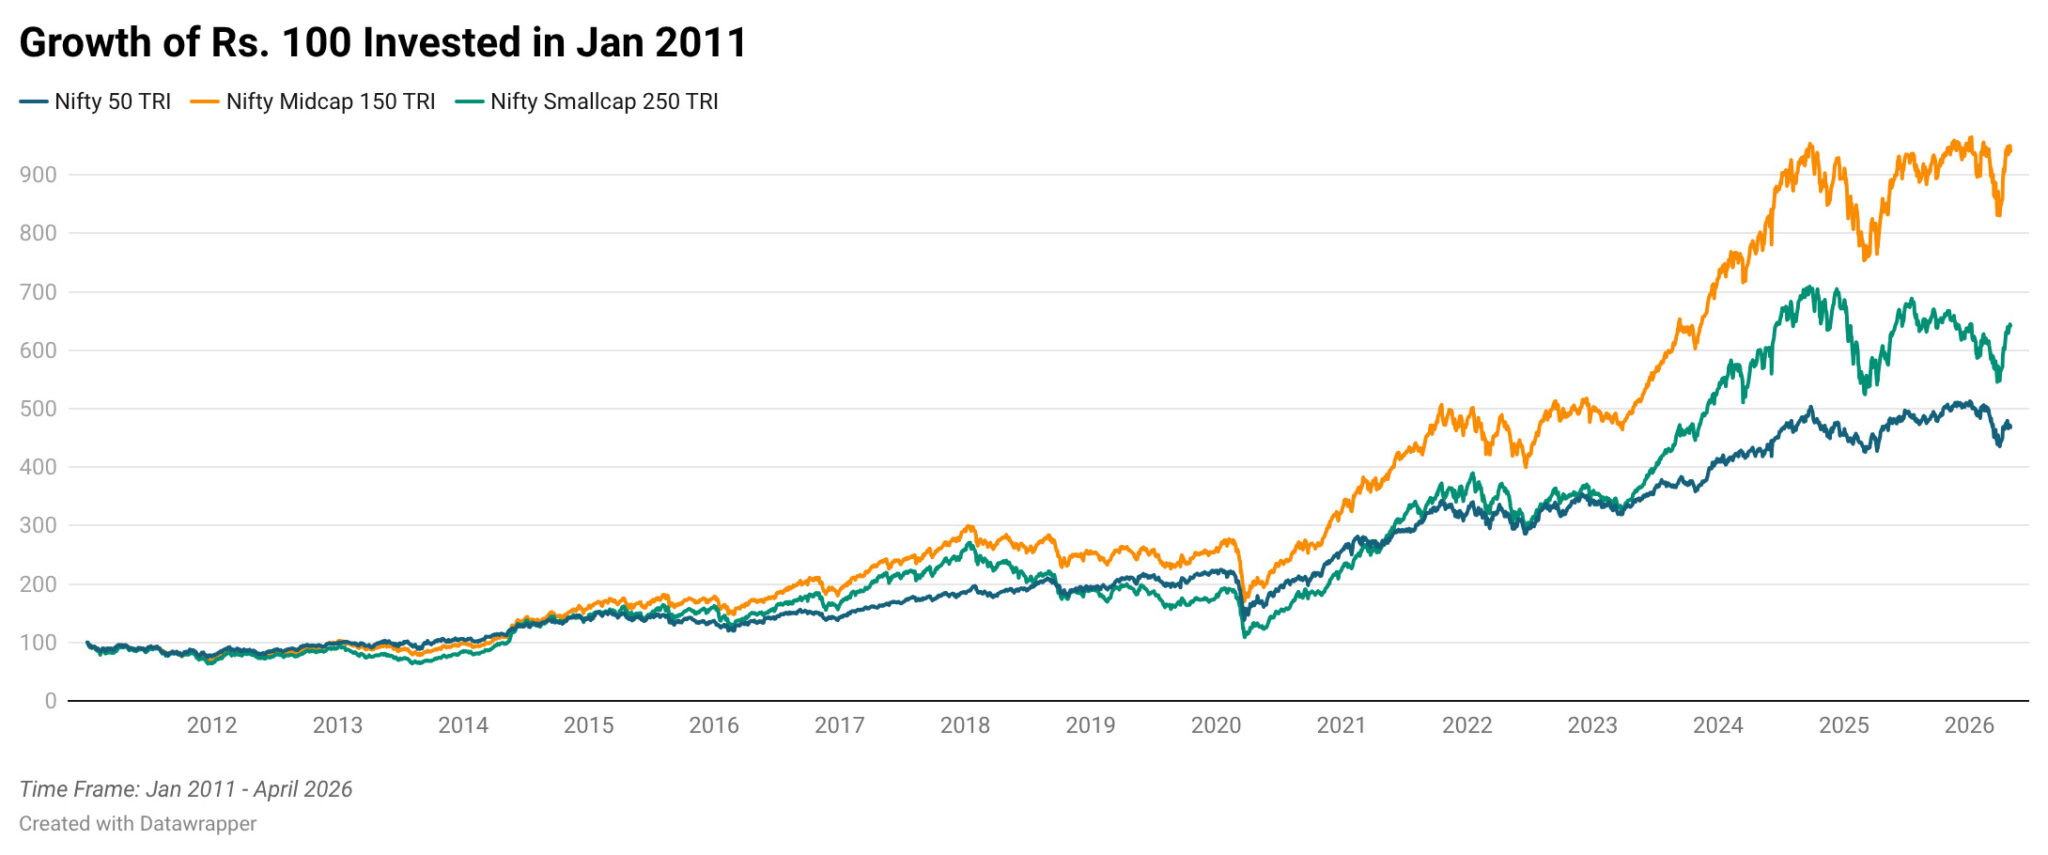
Mid caps won this race, not small caps. That surprises people. The conventional wisdom is that small caps are the highest-return asset class if you can stomach the ride. Over this 15-year window, mid caps delivered better absolute returns and better risk-adjusted returns than small caps. More on that later.
But here's the thing: if you look at just the CAGR, you'd think the answer is simple. Just buy mid caps, right? The problem is that nobody actually earns the CAGR. What you earn depends on when you entered, how long you stayed, and whether you panicked during the drawdowns.
The Year-By-Year Picture
Calendar year returns tell a different story from the CAGR. Look at this:
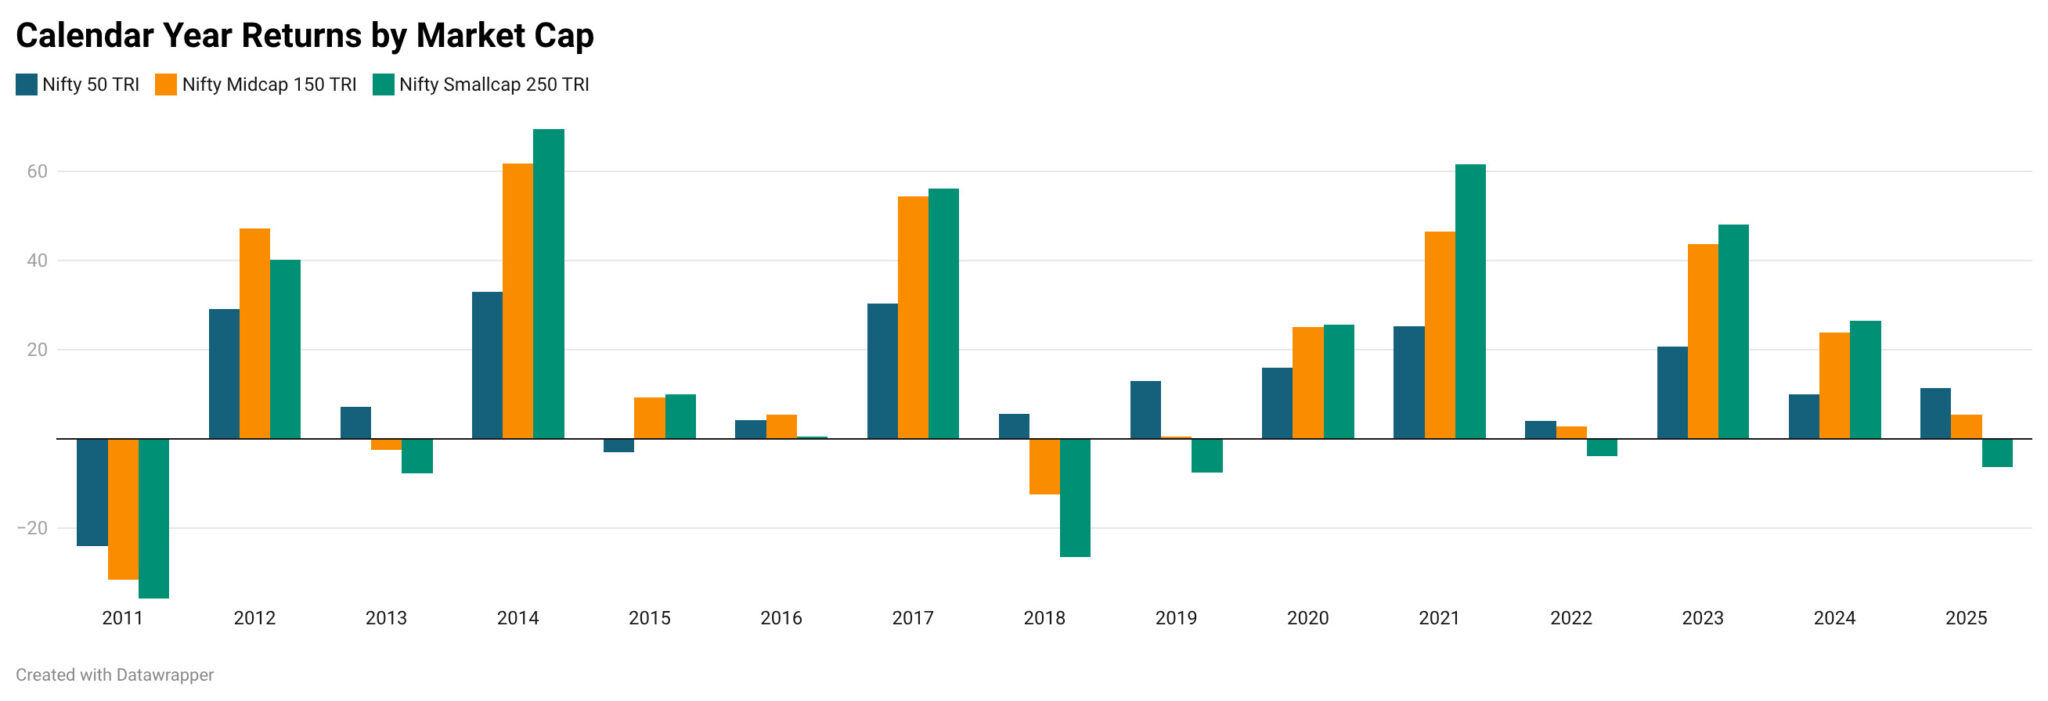
Small caps won 7 of 15 calendar years. Large caps won 6. Mid caps won just 2. But look at when large caps won: 2011, 2013, 2018, 2019, 2022. Those are the down years, the sideways years, the years when fear was running the show. Large caps don't win the bull markets. They tend to win the bear markets. And winning the bear market is how you stay in the game long enough to benefit from the next bull market.
The Drawdown Problem
This is where the story gets uncomfortable for the "just buy small caps" crowd.
Maximum drawdowns (peak to trough) over this period:
Large cap: –38% (COVID crash, Jan-Mar 2020)
Mid cap: –43% (peaked Jan 2018, bottomed Mar 2020—that's two full years of decline)
Small cap: –60% (peaked Jan 2018, bottomed Mar 2020)
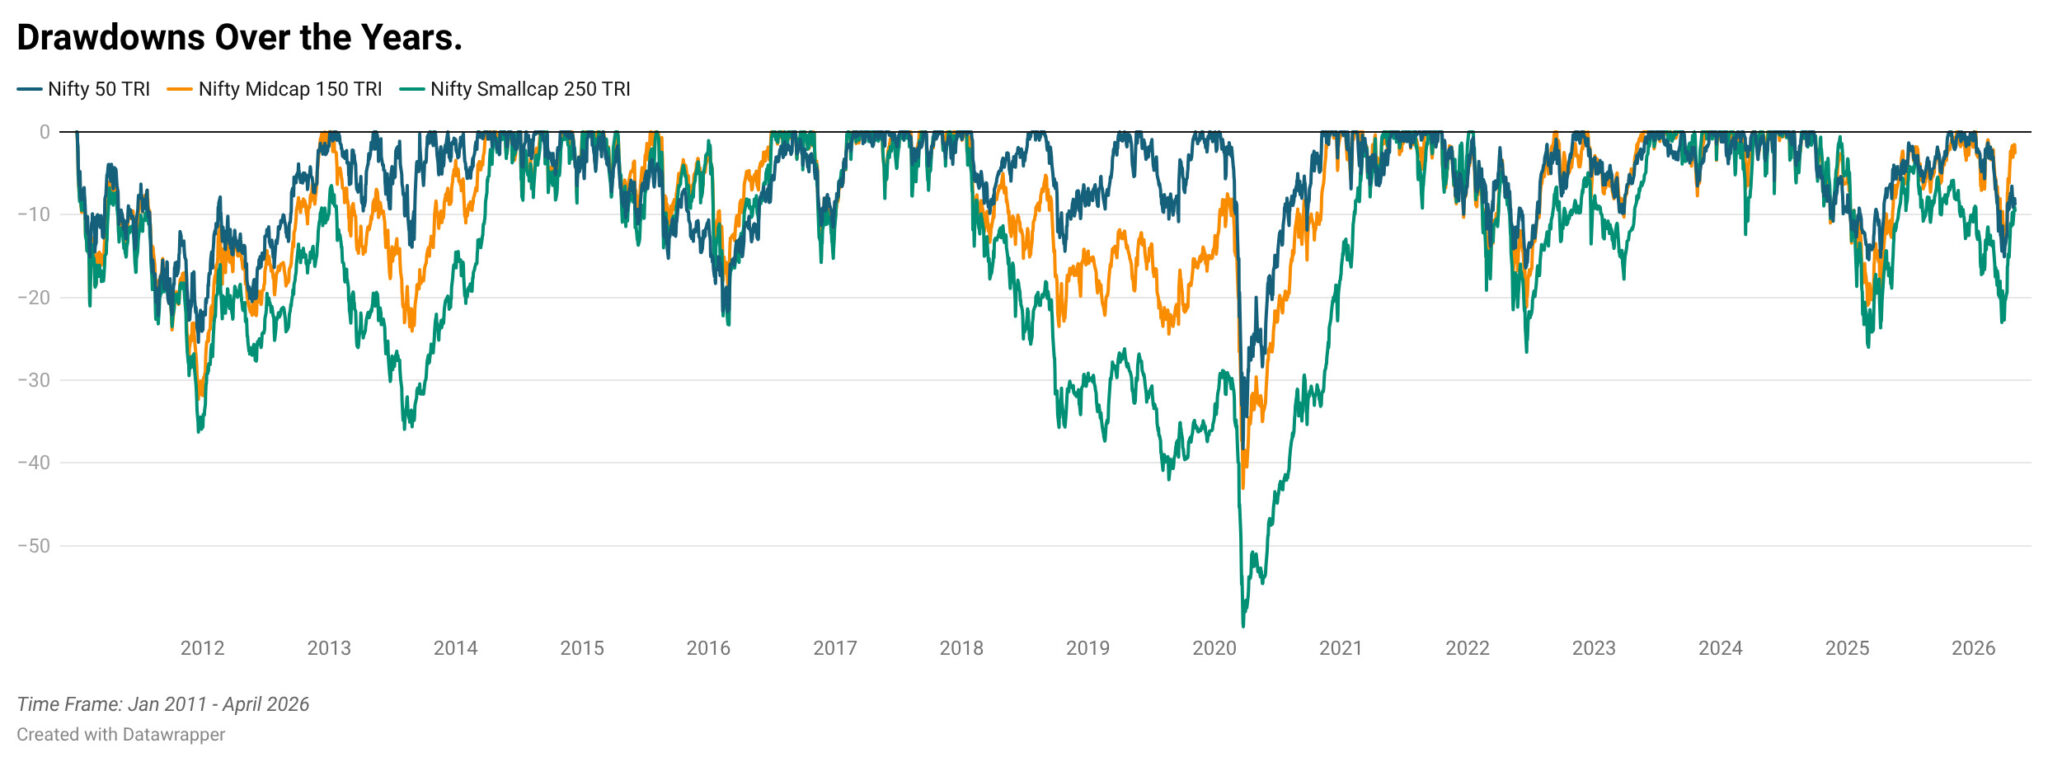
Read that again. Small caps lost 60% from peak to trough. If you had Rs. 1 crore in small caps in January 2018, you were staring at Rs. 40 lakh by March 2020. And this wasn't a quick V-shaped recovery. The 2018 mid/small cap correction started a full two years before COVID made it worse. Small caps were already down ~40% before the pandemic even hit.
Most people can't sit through that. And if you sell at the bottom, the CAGR is irrelevant.
Large caps, by contrast, only fell 38%, and most of that was the COVID crash, which recovered relatively fast. Mid caps fell 43%, landing somewhere in between. A 100% large cap portfolio would have helped you sleep better at night but caused FOMO at different times.
Rolling Returns: The Real Measure
CAGRs are nice as headlines. But what actually matters to an investor is: what return would I have earned if I invested on any random day and held for 3 years? Or 5 years?
That's what rolling returns show. And they're revealing.
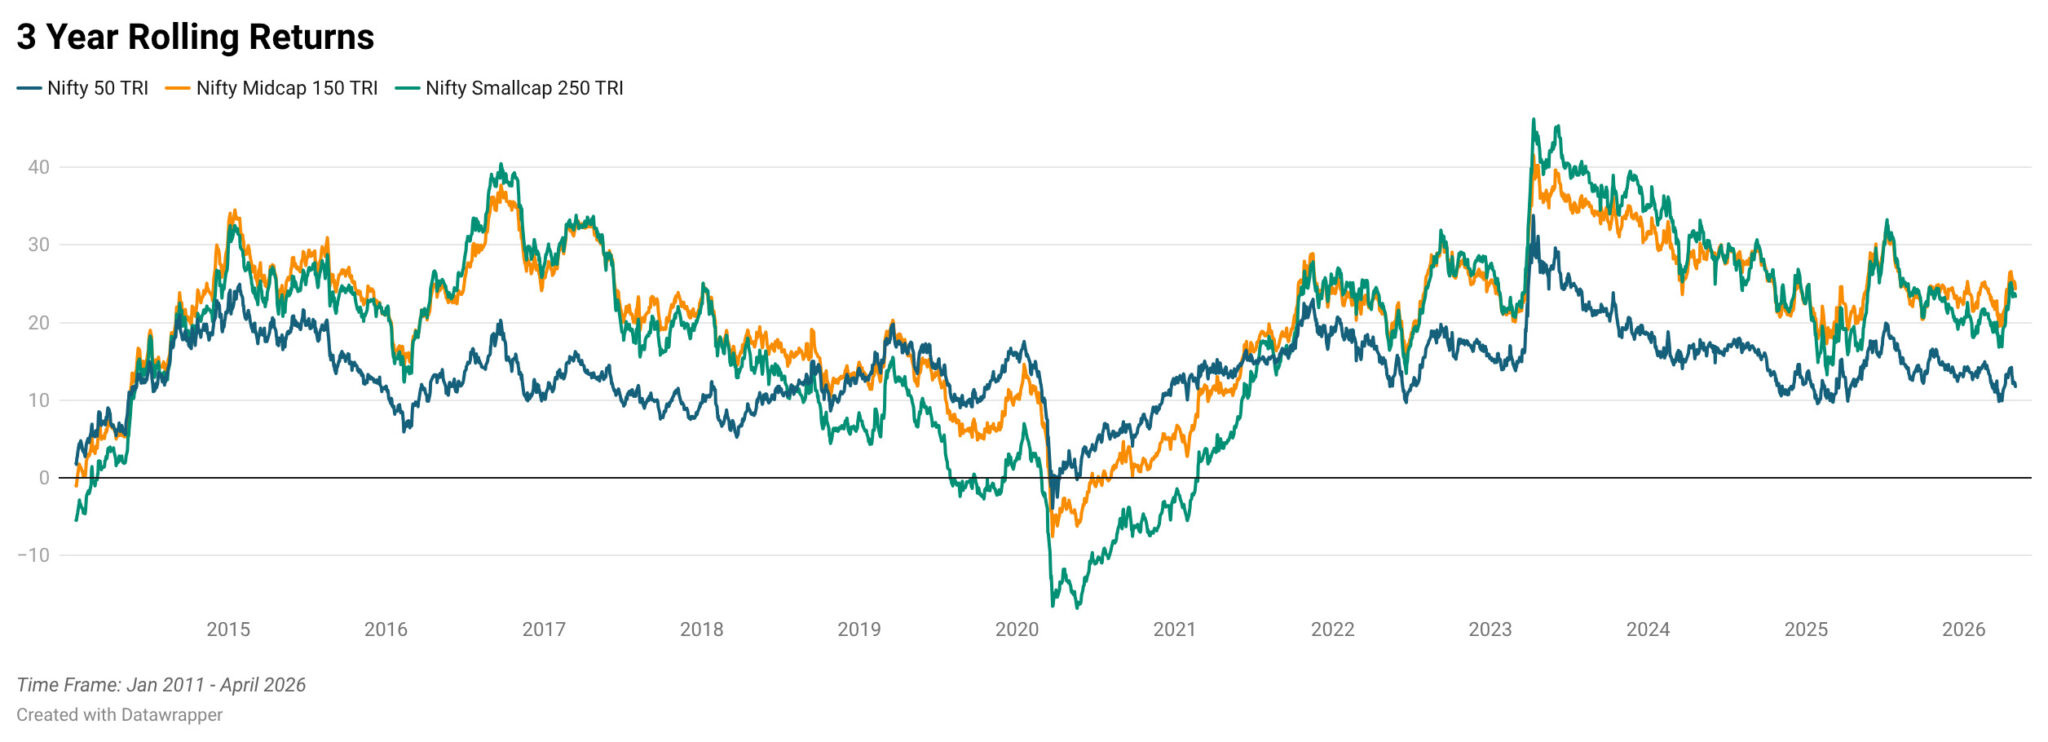
Large caps delivered a median 3-year CAGR of 13.9% and were negative only 0.3% of the time. Mid caps delivered a higher median of 22.3% but were negative 2.3% of the time. Small caps had a median of 21.2% but were negative 9.4% of the time.
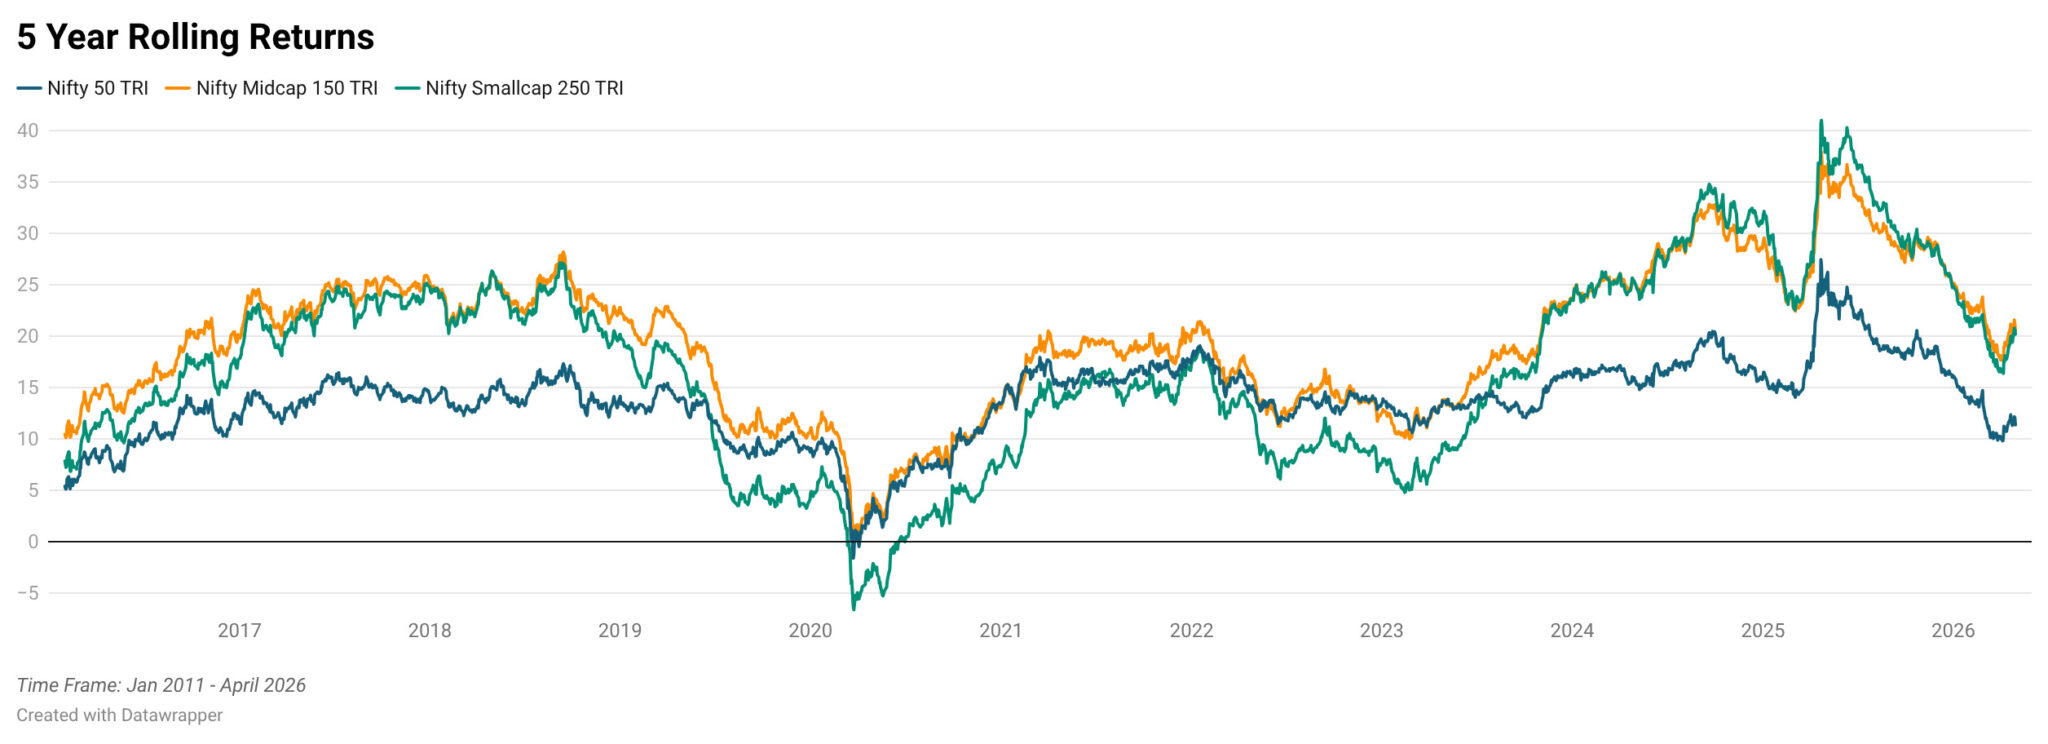
At the 5-year horizon, things get more interesting. The large cap median was 13.9%. Mid cap: 19.7%. Small cap: 16.8%. Notice that mid caps beat small caps again at this horizon. And the probability of negative returns was very low for all three. (under 3% for small caps, under 1% for large caps).
The takeaway: if your holding period is 5 years or more, mid and small caps are likely to deliver meaningfully higher returns. But even at 5 years, small caps had a worst case of 6.6% CAGR versus 1.6% for large caps. The range of outcomes is much wider.
They Don't Move in Lockstep
This is the diversification argument, and the data backs it up more than you'd expect.
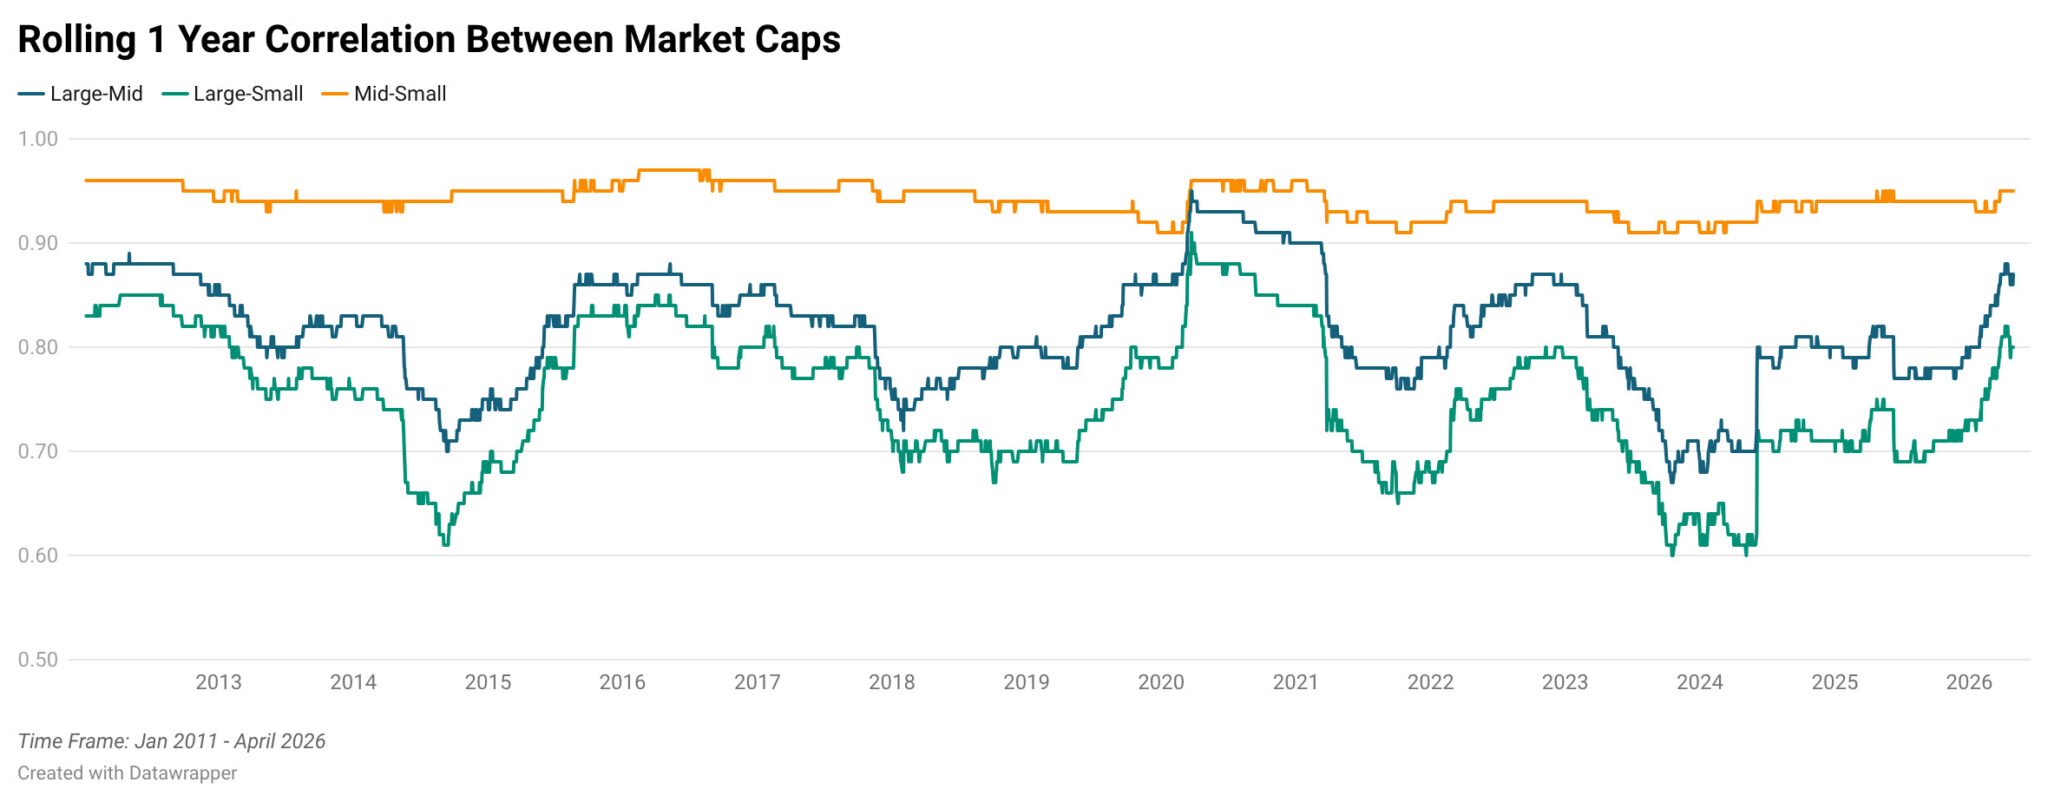
A quick note on correlation: It ranges from –1 to +1. A correlation of 1 means two things move in perfect lockstep, if one goes up 5%, the other goes up 5%. A correlation of 0 means they're completely independent of each other. Anything below 1 means there's at least some benefit to holding both, because they don't always move together. The lower the number, the more diversification you're getting.
Now, let's see how different caps are correlated. The rolling 1-year correlation between large caps and small caps has a median of 0.75. Not terrible, but meaningfully below 1. And it drops as low as 0.60 in certain periods. Large cap and mid cap correlation is tighter at 0.82, and mid-small is very high at 0.94 (they tend to move together).
What this means in practice, large caps and small caps often disagree. In 2018-19, large caps were flat to positive while mid caps and small caps were down 12% and 27%, respectively and then another 8%. In early 2025, large caps recovered first while small caps were still in the red. These divergences are exactly what creates the case for holding both.
What the Cycles Tell Us
Let's walk through the major market phases:
2014-17 bull run: Small caps returned 204%, mid caps 194%, large caps 74%. If you were all large cap during this period, you left serious money on the table.
2018-19 correction: Small caps fell 32% over two years while large caps gained 19%. If you were all small cap, you were questioning your life choices.
COVID crash (Feb-Mar 2020): Large caps fell 26%, mid caps 31%, small caps 37%. In a panic, size matters.
COVID recovery (Apr-Dec 2020): Small caps rallied 93%, mid caps 79%, large caps 71%. The bounce was proportional to the fall.
2021 rally: Small caps gained 62%, mid caps 47%, large caps 25%. The broader market was on fire.
The pattern is consistent, mid and small caps outperform in risk-on environments, large caps hold up in risk-off environments. Nobody knows in advance which environment they're walking into. Which is why you want exposure to both.
So What Should You Actually Do?
The data makes a few things clear:
One, all three cap segments have earned their place in a long-term portfolio. Large caps for stability, mid and small caps for growth. Excluding any one of them means you're making a concentrated bet on a particular market regime continuing.
Two, your mix should depend on your holding period and risk appetite. If you're investing for a shorter period, say 2-3 years, lean heavier on large caps. If you're investing for 5-10 years, you can afford a meaningful mid and small cap allocation because you'll have time to ride out the drawdowns.
Three, there's no single "right" equity allocation to large, mid and small caps. A 33:33:33 or a 50-25-25 split (large-mid-small) is a reasonable starting point, but someone closer to retirement might want 70-20-10, while someone in their 30s with a high risk appetite might go 30-30-40.
The point isn't to optimize the split to the decimal. It's to have all three, in proportions that match your situation, and rebalance periodically.
How We Think About This at Capitalmind Wealth
Everything above argues for owning all three cap segments. But in what proportion? And should those proportions stay fixed, or change with the market?
Our view is that they should change, and all four of our pure equity strategies - India Indices, All Weather Equity, Altitude, and Surge India—provide multi-cap diversification in some form. They sit on a spectrum of risk, and each does market-cap diversification differently.
- India Indices: At one end of the risk spectrum is India Indices - our low-cost market beta investment approach. It's a basket of ETFs or Index Funds that gives you exposure to large and mid caps (no small caps). If you want a large-cap heavy with mid-cap upside market-growth participation without active bets on which cap segment will outperform, this is the straightforward choice.
- All Weather Equity: This investment approach is the middle ground. It's a mix of active and passive mutual funds that has historically maintained around 60% large cap exposure, with the remaining 40% roughly split equally among mid and small caps. Think of it as the one stop solution for your equity investing needs, with enough large cap exposure to keep volatility manageable across cycles and give you inflation-beating returns over long-periods.
- Altitude: This investment approach is where we go up on the risk spectrum. Altitude provides multi-cap exposure tilted toward mid and small caps (i.e., >50% in mid and small caps) but executed entirely through mutual funds. It's for investors who want the risk-return profile of mid and small caps but prefer the mutual fund wrapper.
- Surge India: And at the other end of the risk-spectrum, Surge India is our multi-cap stock-based strategy that actively changes its exposure across cap segments as market regimes shift. When small caps are running, Surge India leans in. When the environment turns defensive, it rotates toward large caps. Historically, Surge India has had a mid-and small cap tilt.
Between these strategies, we can put together an equity allocation where the proportions across large, mid, and small caps match the client's risk appetite and investment horizon, the same two variables this entire article has been about.
We'll write about each of these strategies in detail in the coming months. In the meantime, if you'd like to talk about what the right combination looks like for you, book a consultation call with our team.
Related Posts
 What Direct Foreign Investing Means for PMS
Avijeet Sen
 Decoding 'Trending Value' in India: Insights from the investing classic 'What works on Wall Street'
Krishna Appala
 Are You Holding an Underperforming Mutual Fund?
Sahil Jain
 Rethinking NRI Wealth: From Preservation to Purposeful Growth in India
Akanksha Maulik
Make your money work as hard as you do.
Talk to a Capitalmind Client AdvisorInvesting is not one size fits all
Learn more about our distinct investment strategies and how they fit into your portfolio.
Learn more about our portfoliosUnlock your wealth potential
Start your journey today