(category)Stocks
Decoding 'Trending Value' in India: Insights from the investing classic 'What works on Wall Street'Decoding 'Trending Value' in India: Insights from the investing classic 'What works on Wall Street'
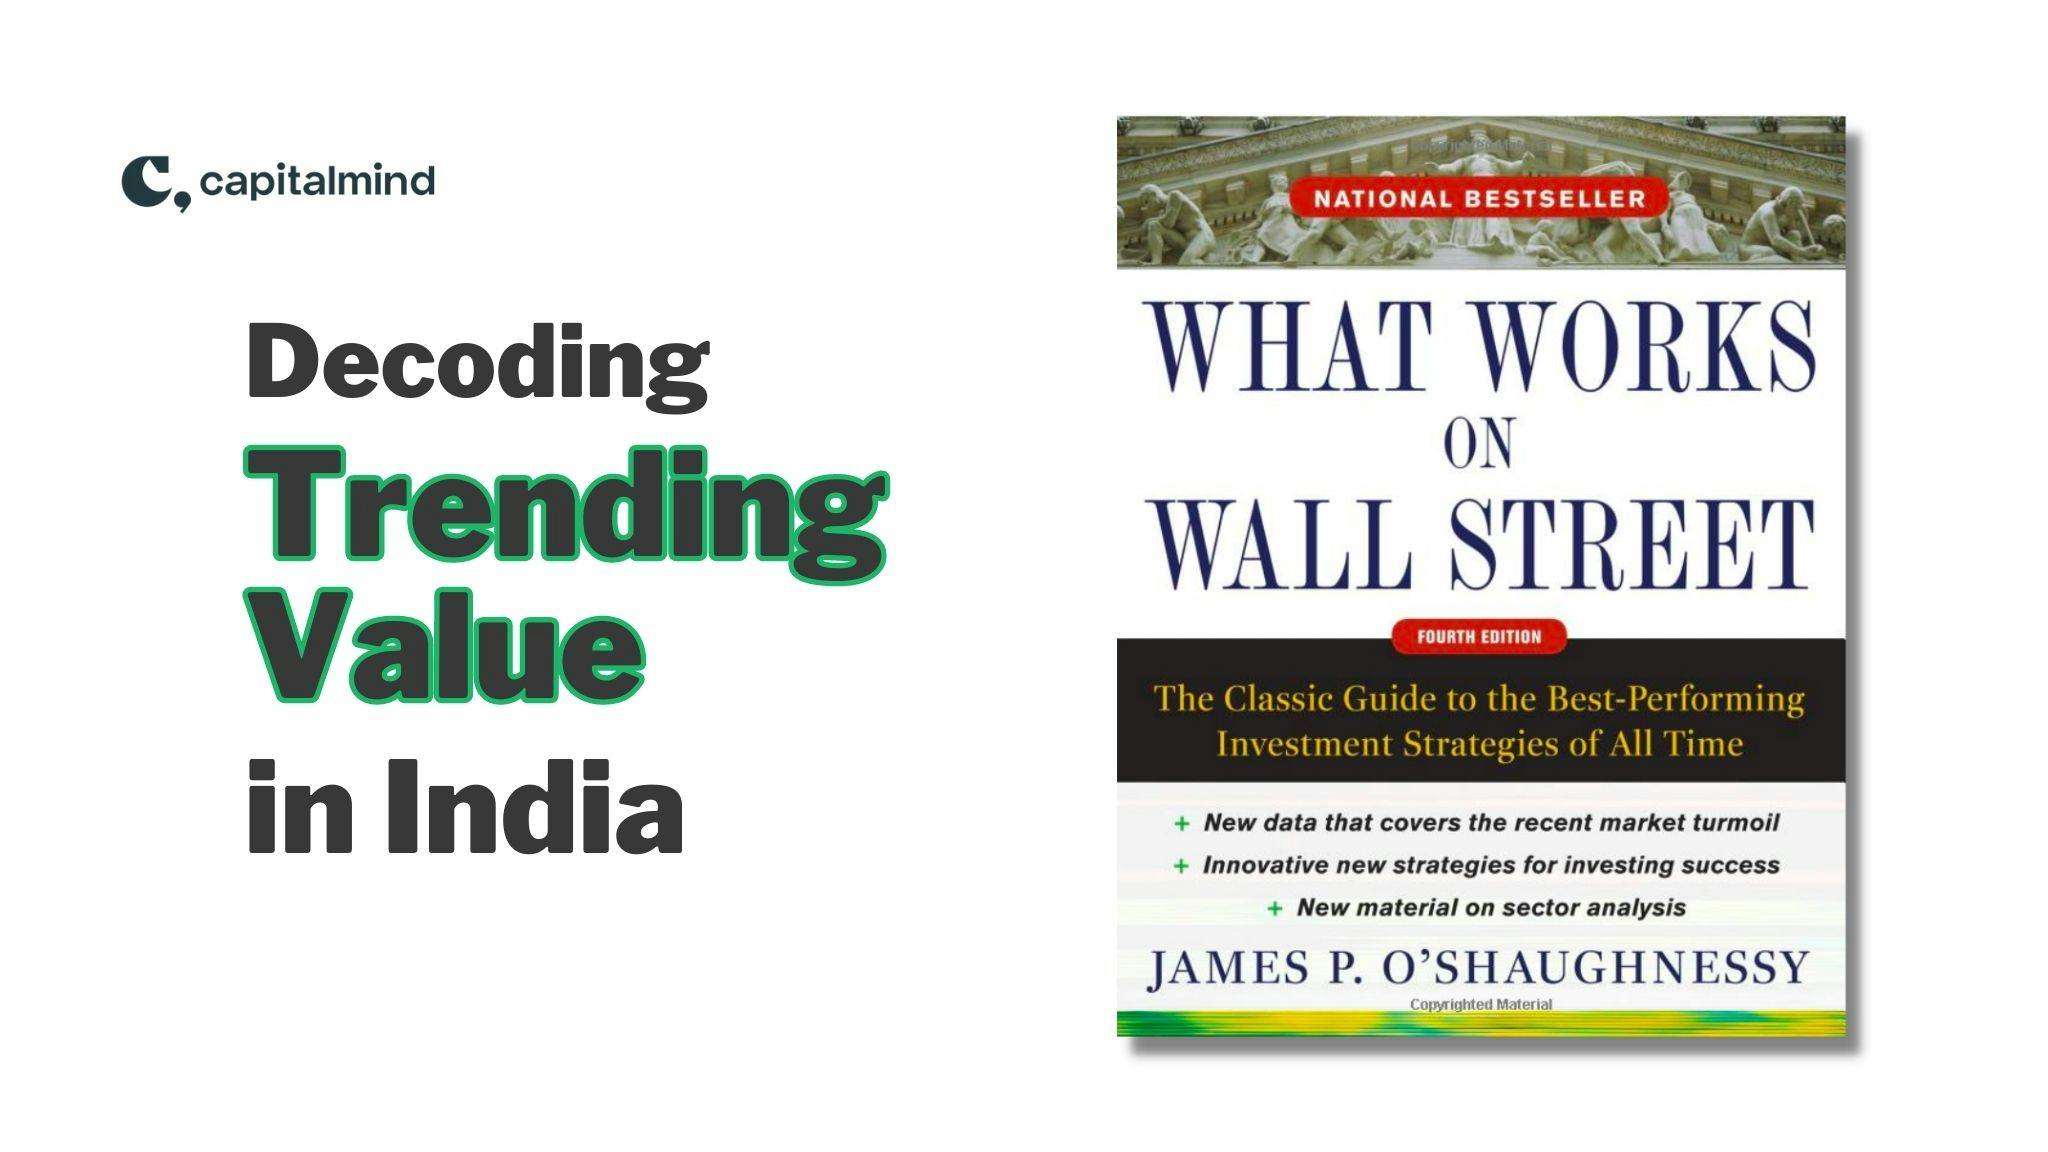
What works on Wall Street by James O'Shaughnessy published in 1997 is the original quantitative investor's handbook. One of the strategies explored in the book "Trending Value" buys statistically cheap stocks showing relative price momentum. We applied the Trending Value framework to the Indian market and found it would have handily outperformed the index but with higher volatility and drawdowns. This post summarises the key findings from applying Trending Value in India.
Krishna Appala•

What attracts you as an investor? Is it a strategy that delivers a high CAGR over an extended period, ideally with fewer drawdowns? Everything else comes later, right? We, as investors, are in a constant search for that 'holy grail' strategy, which may or may not exist in the first place (Not you, Jim Simons).
In this context, any strategy that claims such a feat certainly commands our attention. One such strategy is 'Trending Value' by James O'Shaughnessy, taken from his book 'What Works on Wall Street'. As per him, combining the Value factor with the Momentum factor has generated a CAGR of 21.1% over an eye-popping period of 45 years. That's an impressive outperformance, considering that the S&P 500 delivered around a 6.2% CAGR during the same period.
The Mechanics of Trending Value
The Trending Value strategy is a unique approach that aims to maximize the potential of both value and momentum investing. This could be seen as a kind of Techno-Fundamental approach. At its core, the strategy selects stocks that are undervalued but are also demonstrating strong price momentum.
Hypothesis
The strategy has two components to it: Value Score & Momentum Score.
Step 1: Finding Value
Initially, the strategy ranks all available stocks based on a composite of six different value metrics:
- Price to Earnings (lower is better)
- Price to Book (lower is better)
- Price to CFO (lower is better)
- Price to Sales (lower is better)
- EV to EBITDA (lower is better)
- Dividend yield (higher is better)
These metrics form the 'Value Composite' score. The lower the score, the more undervalued a stock is.
The stocks are then ranked in ascending order based on the Value Composite score, and only the top decile stocks in the universe are selected for further analysis.
Step 2: Finding Momentum
Once the top decile of the most undervalued stocks is identified, they will be ranked again based on their price momentum over the last 6 months.
From this ranking, the top 25 stocks are selected to build an equal-weight portfolio
The portfolio is then rebalanced on an annual basis
*Click on the image to enlarge
Assumptions
For this study, we have made these assumptions:
- Fundamental data: We considered the full financial year reported numbers to calculate the Value composite score
- Data source: FactSet for both Fundamental and Price data
- Time frame: We used 16 years of data, from 2007 to 2023, for backtesting purposes
- Universe of stocks: All NSE-listed stocks without any survivorship bias
- Rebalance frequency: July 1st of every year (as full financial year numbers will be reported by then)
- All the reported returns are on a pre-tax basis
So, here we go...
Reading this chart: ₹100 invested on day 1 in July 2007 be worth ₹1921/- in Trending Value strategy vis-a-vis 448/- in Nifty 50, as of July 1st, 2023.
However, this outperformance comes with the trade-off of facing higher drawdowns. For the majority of the period, the portfolio encountered considerably larger drawdowns when compared to the Nifty
One key metric to assess the robustness of any strategy is by considering rolling returns. On a 1-year basis, the strategy outperformed Nifty about 59% of the time. This outperformance further increased to nearly 70% when viewed on a 3-year rolling return basis.
One interesting observation is that, when examining the returns for each calendar year, the outperformance comes in chunks. There are specific years where you experience remarkable and outsized returns, followed by periods of steep drawdowns and consolidation. This cyclical pattern of chunked outperformance repeats approximately every 3-4 years.
Where are the returns coming from?
Let's dig one step deeper and have a look at the returns distribution. Where is this alpha coming from?
This strategy has had a total of 592 trades since its inception. Let's segregate them into different buckets (market cap, win rate, loss rate, average fundamental metrics, etc.) to understand what contributed to both the returns and the volatility.
1) Market Cap Rank Distribution: The strategy picked more than 50% of the trades from companies with a market cap rank (note: this is market cap rank and not market cap value): between 500 and 1000. A total of 78.7% of the trades were with companies ranking between 500 and 1500 in terms of market cap. This suggests that it's a small-cap strategy.
2) Returns Distribution: This can also be inferred from an analysis of our top winners and top losers. The biggest winners have a market cap rank between 500 and 1300. That's where this strategy truly thrives.
3) Fundamental Value Distribution: Now let’s look at the fundamental value metrics that met the criteria for inclusion in this portfolio. For each portfolio on an annual basis, we present the median fundamental metrics. This will give us an overview of the quality of stocks that have been added to the portfolio
Do start dates matter? - Not really
But what if you stumbled upon the perfect starting date by sheer luck? To eliminate the reliance on a specific starting point, we put this strategy to the test with different beginning dates spanning from 2008 to 2013, allowing us to observe the results over a minimum period of 10 years.
Few observations from the chart
- The strategy consistently outperformed Nifty. However, the outperformance varied depending on your starting point
- As the strategy invests heavily in small caps, the volatility & drawdowns are much higher than the benchmark
- Approximately 70% of the time, the strategy outperformed Nifty even on a 3-year rolling return basis, indicating the long duration of the small-cap market cycles
Limitations
- This strategy is not for everyone. It is a high-risk high-reward strategy that requires a high tolerance for volatility
- Sometimes, it takes years before the strategy shows any outperformance over the Nifty. For example, if we consider the start year as 2011, it took around 4 years for the Strategy NAV to outperform Nifty NAV
What’s the bottom line?
- This is a small-cap techno-fundamental strategy and closely mimics the small-cap market cycles
- Historically, the strategy picked up companies that are trading at an average Price to Earnings of <5 times PE and Price to Sales of <8 times TTM
- Returns come in bulk. If we miss those years, the performance may be muted. For example, as shown in the table above, the bulk of the outperformance came in 4 of the last 16 years (from 2014 to 2017), generating more than 30-60% alpha each year
- The strategy (with a 10-year CAGR of 39%) has done relatively better when compared to small-cap mutual funds such as Nippon India Small cap (10Y CAGR of 29%) and SBI Small cap MF (10Y CAGR of 27.5%).
Further Reading:
- Time the market with Yield Spread
- The Smelting of India stocks
- The pitfalls of mid & small-cap investing
Disclaimer: This post is for information only and should not be considered a recommendation to buy or sell stocks. The analysis is based on data from reliable sources, but do point out any discrepancies you find.
Related Posts
Make your money work as hard as you do.
Talk to a Capitalmind Client AdvisorInvesting is not one size fits all
Learn more about our distinct investment strategies and how they fit into your portfolio.
Learn more about our portfoliosUnlock your wealth potential
Start your journey today


