To everything turn, turn, turn, there is a season turn, turn, turn
And a time to every purpose, under heaven – Peete Seeger
After an almost perpetually trending 2020, the month of March’21 hit us like a hail storm. Making us wonder if it’s even worth our time trading trend following strategies like Chase. To a large extent we all anchored our expectations based on the year we started. We never experienced a range-bound whipsawing market, thankfully now we have.
What is a whipsaw?
Traditionally a whipsaw is defined as – a condition where a security’s price heads in one direction, but then is followed quickly by a movement in the opposite direction.
While this is what a whipsaw is, quants like us would like some numbers to play with, which brings us to the next question.
How do we define a whipsaw quantitatively?
To define a whipsaw you need either of two approaches or both.
You define a price channel based on the past x day’s high and low range. If the price crosses either the high or low of that range and reverses back to the range within a specified time that’s a whipsaw
You can also define a mean price, if the price closes above or below it and then reverses and closes on the other side of the mean, within a specified time – that becomes a whipsaw too.
Here’s a visualization of how a whipsaw may look on a chart, if you see we have a moving average line, and we go long when the price crosses the moving average shown here with a green-colored L and we exit if the price closes below the moving average, shown here with an E. Likewise, a short trade is shown with a red-colored S.
If you notice, none of the signals lead to persistence in trends, and that’s when we say – we are getting whipsawed.
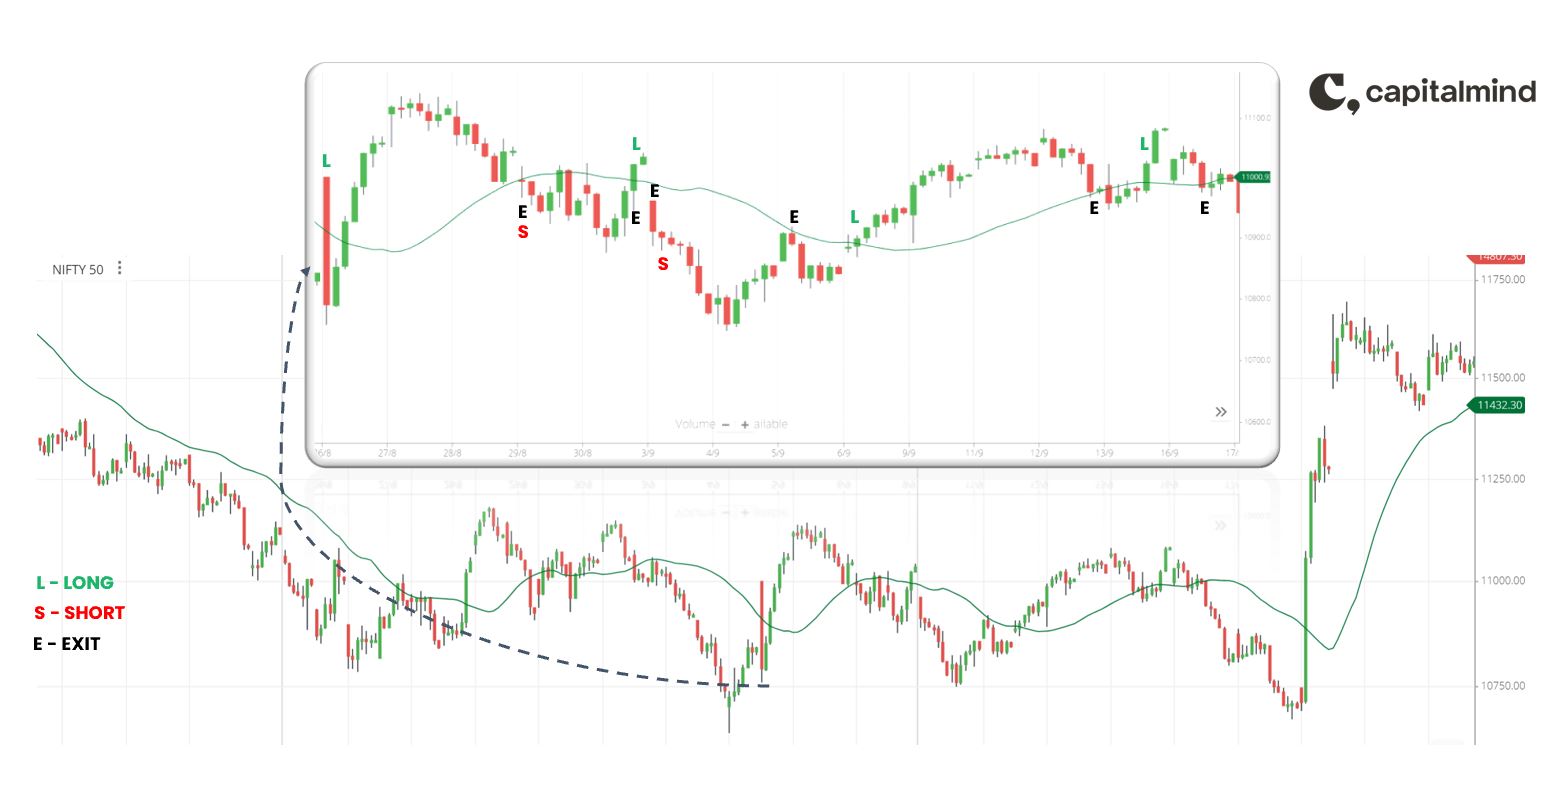
The chart here is from a two-week choppy period in August end of 2019 just before the legendary ‘Nirmala’ candle happened.
You see, there are periods when price persistence deteriorates and that is when we get multiple trades entries and price reverses, SL hits.
From an equity curve or a p&l perspective consecutive losses on the active component of Chase is an indication of a choppy period on an hourly time frame ie.
Not all whipsaws are bad, whipsaws on our timeframe are bad for us. For instance, if our timeframe is Daily choppiness on an hourly time frame won’t bother our system
Look at these two charts, both on different time frames, one is on a 40 period hourly and the other on a 40 period daily. You are getting whacked on hourly while the daily (inset) seems to be calm. Now, look at the next chart.

Feb to Apr 2021 | NIFTY50
Here you are getting whacked on daily (inset) but hourly is relatively calm.
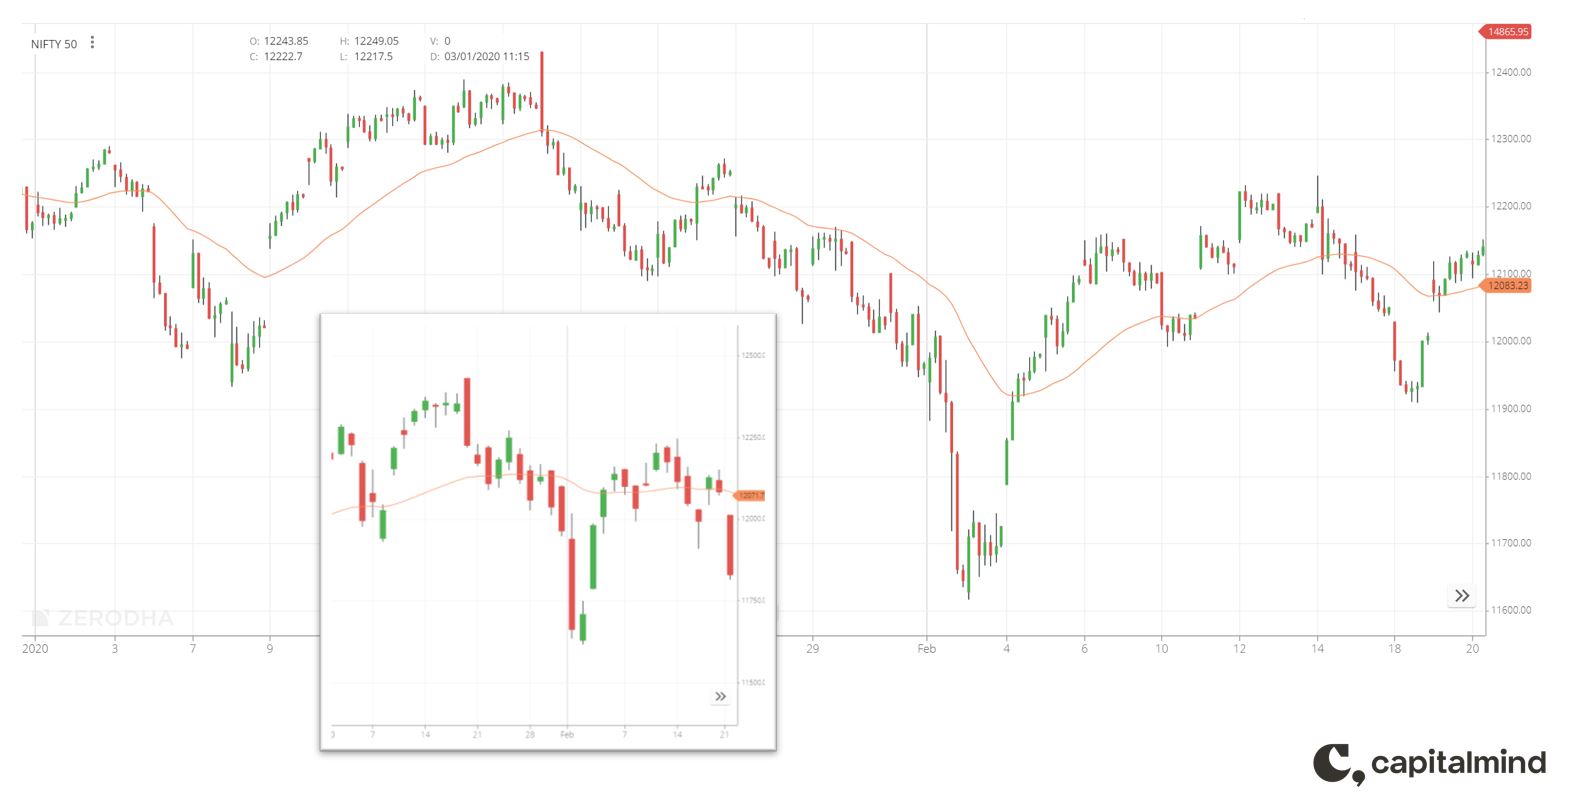
Jan to mid-Feb’ 2020 | NIFTY50
I am sure you get the drift here, to repeat, we are concerned about whipsaws on our timeframe, they happen more often on shorter timeframes than on longer time frames though.
Given that, we are bothered only about whipsaws on our time frame, let’s dig into Chase back-test data to get a better sense of how often do these whipsaws happen for us.
How often do whipsaws happen on Chase?
To answer this question we will use Chase trade logs (back-test) from 2008 to 2019 and actual trade logs of 2020 and 2021.
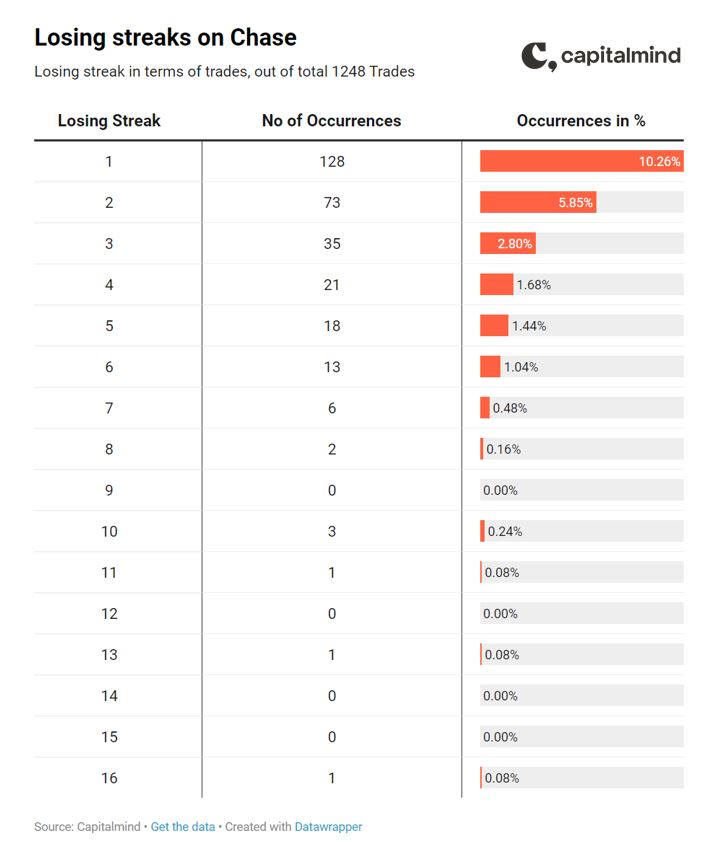
In the chart below you see trade-wise whipsaw frequency, you have approximately 1200 trades since 2008 which is 100 trades a year. This is for the Futures (Active) component of Chase.
We ignore streaks up to 4 consecutive losing trades which are obviously very common.
There are 18 exclusive max 5 consecutive trade streaks that happen a little more than once a year. While, the next max, 6 consecutive trade streaks, there are 13 of them which is, once a year.
To put the recent 8 consecutive losing trade streak in context, it was a once in 6 year event.
At max, we’ve had a 16 trade losing streak which happened sometime in June 2012.
How much do we lose when we go through these losing streaks? And yes, how long does it take for us to recover that loss?
For this, we look at streaks greater than 5 consecutive trades long and how much we lose in terms of % of the index. In the table below you see streaks that have lasted for a minimum of 5 consecutive trades.
This is how you would read the first row of the table below.
Losing streaks of max 5 consecutive trades length, have caused a max 6.85% loss of index value, the average of all the max 5 consecutive trades length losses have been 2.79% and it takes 14 calendar days on an average to recover from these streaks and at max 42 days.
Again looking at the 8 consecutive trades streak – on average, it could take 78 days to recover the losses from it and at max historically it took 146 days, i.e. almost 5 months.
The chart on the left represents only the futures component and the one on the right represents CHASE, skim through the days-to-recover column both average and max days. and you would get a sense of how Chase cushions losses and helps you get back on track, esp. in up-trending markets.

With some of our worries settles, I guess so. Let’s look at why do these whipsaws happen.
Why do whipsaws happen?
Let’s invert the question and ask – Why do trends happen?
Since we are dealing with indices here, we all know by now that, if the indices go up persistently we have a trend.
But what makes indices go up persistently? Since indices are made up of constituent stocks, if the constituent stocks go up persistently we have a trend in the index.
So far so good.
What would make constituent stocks go up persistently?
You need someone to buy those stocks consistently, to know more about who owns how much in our markets, and who has the power to move the markets, you must listen to this episode on our podcast – and an excerpt from the podcasts below tells us who the key players are.
“Promoters own 50% of the market capitalization of Indian stocks. Of the remaining listed market cap – half is owned domestic retail and institutions like mutual funds and insurance companies and corporates. And everything else – half of the non-promoter/free-float is owned by foreign institutional investors. This is huge because it means 1/4th of our market is owned by FIIs – that’s roughly 26-27 lakh crores (400 billion USD)”
It is these key players who move the markets by buying or selling in the cash markets.
Why they buy and when are questions that would lead us to aspects like global liquidity, and other such macro factors.
Going back to where we started
Whipsaws or range-bound markets happen when the conditions that lead to trends do not exist. It can be a lack of buying in index constituents, or even if there is buying in constituents it could be selective and not across constituents, any of these combinations could lead to range bound markets.
But then like all things in life, economies too move in cycles. There are periods of low and no returns and then large trends more than makeup for those periods, it’s lumpy yes, but that’s true to almost any kind of investing or business.
There is indeed a season to everything.