
[level-capmind-pro]
Here’s an update on the MA20. I believed we might have seen a bottoming out of the prices earlier today, but it’s definitely not so!
(The MA20 is our proprietary indicator about market breadth. The MA20 is calculated by taking the number of Nifty stocks above their 20 Day Moving Averages, and we subtract from this number those that are below. Since the Nifty has 50 stocks, this calculation will oscillate between -50, when there are no stocks above their 20 DMAs, to +50 when there are no stocks below. We have found that trading opportunities exist when the indicator goes above +30, or below -30, and turns around. )
Here’s the MA 20 in it’s glory:
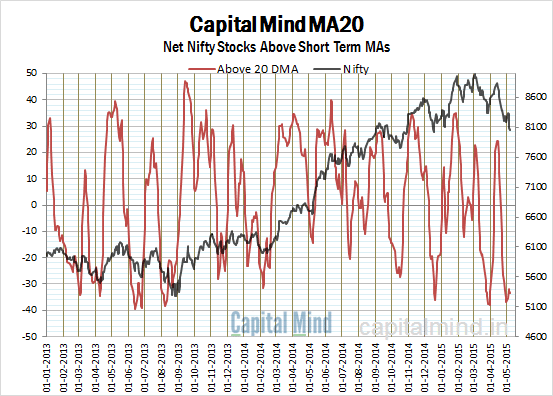
The MA20 remains lower than -35 and is not giving us a buy signal just yet. We mentioned on the group about buying calls, and it was based partly on the assumption that the MA20 will turn. But it hasn’t turned.
Having looked though at the way the market stunned everyone by quickly moving up when it touched below 8,000 , and that tomorrow’s a friday (when typically traders reverse their positions to end a good trending week) it seemed that tomorrow would provide a bounce.
But The Reversal Chances Are High: A Morning Doji Star Pattern Building Up?
The Nifty has closed at 8057 which is the lowest for 2015. It even went below 8000 intraday, and at the very end, recovered substantially. This made me believe we might be headed in for a change of trend, given that it was a “doji” day. (where the open and the close are near each other, but the market moves up and down substantially).
In the past, we wrote about the Doji as an indication of the end of a trend. This is in the form of a Morning Doji Star, a three-candle technical pattern formed by:
a) big bodied black candle
b) gap down doji day
c) then a big bodied white candle with a gap up
As you can see in the chart below, we have seen two such instances in the very recent past, where a Morning Doji Star saw a quick short term reversal.

Today we’ve done a) and b) of the pattern. Will tomorrow gap up? If so, it would be a strong indicator of a trend reversal.
Buying Calls: What’s the Plan?
We recommended buying the 8200 call at Rs. 93. If the market does not gap up tomorrow, the reversal chances are low; At this point the market will have to tell us where to exit – a further fall means an exit, a flat open means find opportunities to exit, and so on. We can’t see anything less than a 50% lower stop on the calls, so this is an EXTREMELY risky trade.
If it does move up strongly, we would look at targets of 150, 180 and 200. (Booking part gains at each level).
This is a “What if” trading plan. The entry is on a technical pattern; the exit is based on specific events occurring (Gap up = hold, down=sell, flat=find opportunities). Money management is in place with stop losses and potential targets. Much will change according to how markets actually move, but it’s better to have a plan to start with (and change appropriately).
The news flow sucks, but usually it’s a time like this when markets are exhausted of selling that we see reversals. Don’t expect the reversals to last too long – the idea here is to trade it, not to attempt to justify that the economy is back to extreme hotness. It’s not.
![]()
Disclaimer
Nothing in this newsletter is financial advice and should not be construed as such. Please do not take trading decisions based solely on the matter above; if you do, it is entirely at your own risk without any liability to Capital Mind. This is educational or informational matter only, and is provided as an opinion.
Disclosure: The authors at Capital Mind have positions in the market and some of them may support or contradict the material given above, or may involve a direction derived from independent analysis.

[/level-capmind-pro]