It has been an interesting couple of weeks for Indian equities. The markets suffered a slight tremor the past week as the major broad-market indices, the Sensex and the Nifty went down slightly on Tuesday and Wednesday, only to surge back upwards over the last 2 days of the week.
As we approach the end of the year, we decide to look back at how the Nifty has performed so far this year.
We are looking at the performance starting from the opening value of the Nifty on 01 January till the end of 19th December 2014, last Friday.
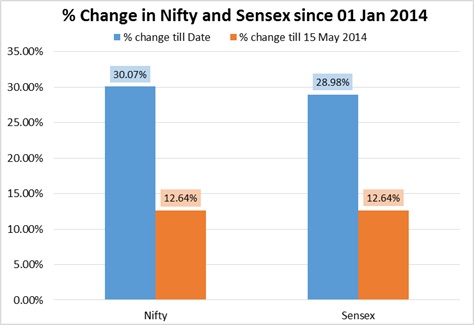
The Nifty opened this year at 6,323.80 on 01 January while the Sensex opened the year at 21,222.19. As of the end of 19th December, the NSE had moved up by 30.07% to end at 8,225.20, while the Sensex rose 28.98% to end the previous Friday at 27,371.84.
For comparative purposes, we decided to split the year into 2 phases: one, from 01 January till the end of 15th May, and two, from the end of 15th till December 19th.
The bottom line is that if one had invested in an index-based fund, or a fund that follows the stocks in the indices in their exact proportions, one would have made 30.5% on the Nifty and roughly 109 bps lower than that, if one followed the Sensex. Of course, these indices do not track the effects of dividends paid and reinvested, so chances are one would have got higher returns than those numbers evince.
Nifty vs Sectors
It makes interesting reading to compare the performance of the broad market vs individual sectors. We used data from various NSE sectorial indices (e.g. the CNX Auto, CNX Bank etc.) for these comparisons.
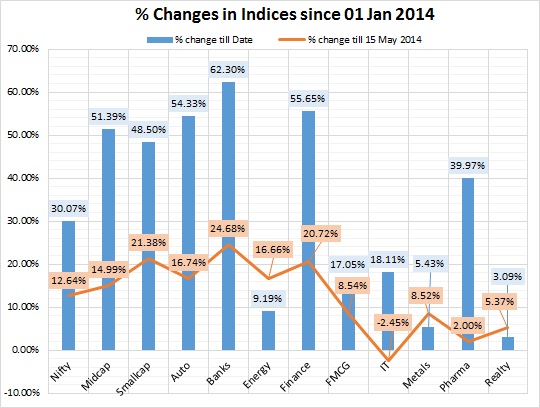
A quick look at the chart above throws up some interesting points:
1) As of today, the following stocks seem to have outperformed the market (as represented by the Nifty):
- Midcaps.
- Smallcaps.
- Auto.
- Bank.
- Finance, and
- Pharma
2) These stocks have underwhelmed compared to the market:
- Energy.
- FMCG.
- IT.
- Metals, and
- Realty.
3) Until the 15th of May, Energy stocks were actually outdoing the broad market, but from then onwards, their performances have gone down.
4) IT stocks were down till 15 May, but went up strongly since then on.
5) Pharma stocks went berserk! A modest near 2% returns till Election Day, while from then on, these stocks shot up straight into the stratosphere! Pharma stocks have returned almost 40% since 01 January.
6) Bank stocks have shown a whopping 62.30 % returns so far, overshadowing any of the other industries.
7) Realty, Metal and Energy stocks are still doing poorly in comparison to the Nifty.
We will update these charts at the beginning of next year for a more comprehensive report on the performance of the indices.
![]()
Subscribe to Capital Mind:
To subscribe to new posts by email, once a day, delivered to your Inbox:
[wysija_form id=”1″]
Also, do check out Capital Mind Premium, where we provide high
quality analysis on macro, fixed income and stocks. Also see our
portfolio which has given stellar returns in our year, trade by trade
as we progress. Take a 30-day trial:
[wysija_form id=”2″]


