We discuss Bollinger Bands in the latest at MarketVision.
Bollinger Bands
Today we take a look at Bollinger Bands. John Bollinger invented them in the early 80s, and they comprise a simple moving average with volatility envelopes around them. The idea is that the bands determine much of the range in which the stock should play – if it breaches these envelopes there is interesting trading action.

So a BBand(20,2) simply means take the 20 day moving average, and over the past, calculate 2 times the standard deviation around the moving average. (We have discussed how to calculate the Standard Deviation in a past Chronicle, and I’ve also written on Moving Averages) You take the 20 day average, plot it over time, take the 20 day Standard Deviation of that, multiply by 2 and add to the stock price to get the upper band value of the day. And the same for the lower band, except you substract 2x the SD. If you do this for each day, you get a curve for the upper band and one more for the lower band.
20 and 2 are simply defaults – but you could choose a faster average and a closer SD for a shorter term analysis in volatile markets (say 10, 1.5). I stay with 20,2 not just because it doesn’t make a lot of difference, but because everyone else also looks at 20,2.
2 times the standard deviation is just to create the envelope; it gives you no guarantees that the price will stay within this range. The idea is to create a “volatility” envelope, so if the price moves fast, then the bands will expand because the SD will increase – after all a sharp move means a higher deviation from the mean.
Armed with the mathematical definition we might conclude that in a normal distribution, the 2x SD means that prices will stay inside the 2SD range 95% of the time. Correct?
Wrong.
The problem is that stock prices are not in a normal distribution. Markets are not efficient, prices are never normally distributed. So a breach of the 2SD line many times – too many times – results in an uptrend that occurs mostly above or near that upper Bollinger band. See the chart of a recently uptrending stock, Bata:
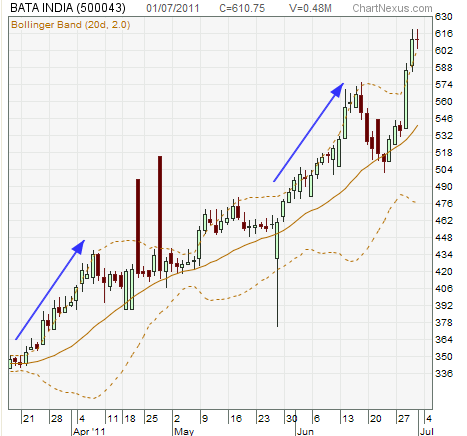
You might actually do better chasing the trend than assuming the trend will reverse. Even if, in the last 18 months, the index has moved just 4% in absolute terms. (This stock, Bata India, has gone up 300% in the same time. Even when indexes go nowhere, some stocks will move)
How do you trade Bollinger bands?
John Bollinger has identified W and M setups as interesting ways to trade price action. What follows is the chart of ICICI bank in mid-2010. The left side of the W was a downtrend that reversed from outside the lower Bollinger band. The recovery was short, and then went into the right hand side of the W, but (and ignore the big green bar – that’s just invalid data) it didn’t breach the lower Bollinger band. And then on the way up it broke the last high – which is your entry setup.
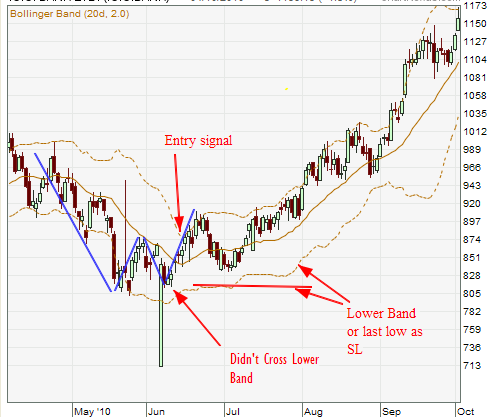
It’s only a setup, not necessarily an actual entry, because you may need to confirm with other indicators – momentum, open interest, volume or others. In this case the volume was increasing and RSI (a momentum indicator) was sloping upwards. A stop would be the lower band breach, or the last low (of the second leg of the W. (But stops can be a number of things. You could use a lower low, a profit target, a % retracement from the last high or what are called chandelier exits, a moving average crossover, a leveling of volume – exiting is a completely different and more dynamic method)
The M setup is the exact opposite – it recognizes tops. In this RCOM chart you can see the price fall from after a high that was at the peak of the upper band, form a 135 base and go up to 143. The price failed to touch the upper band or make a new high, both signs that the price could fall. This is your setup, now the trigger will be the price falling to the lower band or crossing the 135 low, which it did to complete the M. At the same time, you saw a 14 day Relative Strength Indicator (RSI) slope downwards to confirm the weakness.
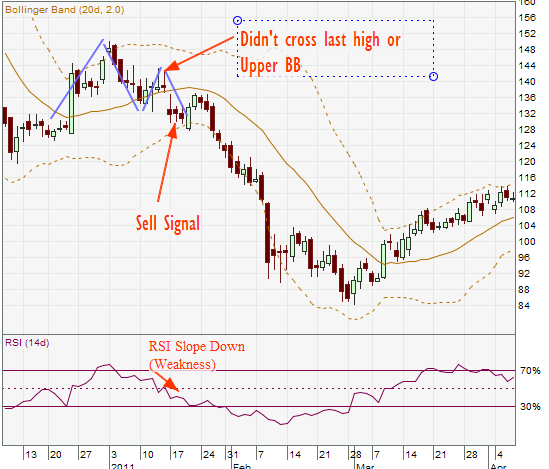
At the same time, the 2G scam was unveiling itself – A Raja was arrested on Feb 2. RCom’s potential downfall was due to that; but look further in the past and you see at least two more M-Tops for RCom in the year earlier.
Another way to trade is to look at Band Width, that is, if volatility is contracting or expanding. The narrower the bands, the more likely the stock is break out. If you plot the band width as a separate indicator, then if the band width shows a low and then a rise, followed by some volume, and then a breach of either then lower or upper band, we might have a signal.

Note however, that such signals have known to give fake breakouts often, so you must operate with a stop loss or use other confirming indicators. I’ve used volume directly here but you might use open interest, or rate-of-change (RoC, a Momentum indicator) or even a fusion, such as Intraday Intensity. (This is simply a formula that uses volume).
Lastly, the band width as an absolute amount – UpperBandValue Minus LowerBandValue – is not likely to be that good an indicator when the stock moves a lot. A 100 point band width when the Nifty was as 6000 is different from when the Nifty was at 2800. So you can use the width as a percentage of the mid-price (the 20DMA) instead. This is called the %b which unfortunately doesn’t exist in many software packages, but if you use Ninjatrader, AmiBroker or Wealth-Lab you can design your own and put in there. Another day I’ll show you how to get prices into these packages, using a video or such.
The use of Bollinger Bands is interesting in that they help you discover stocks that might be showing activity. Once you get them, you need to confirm the signal, using some other indicator. More importantly, the bands give you an idea of whether the stocks near a relative low or a relati
ve high, and that can help you determine action.
The Bank Nifty Trade I had mentioned in the last newsletter had to go out because of a stop loss – I took off half the position as I mentioned on Twitter and on my blog recently. I had kept half the position on “for fundamental reasons” – i.e. I knew the price action was against me but I still retained the But as the price walks up the upper band, and there’s an obvious W bottom now I believe the price action is getting worse for a short position, and am very cautious.
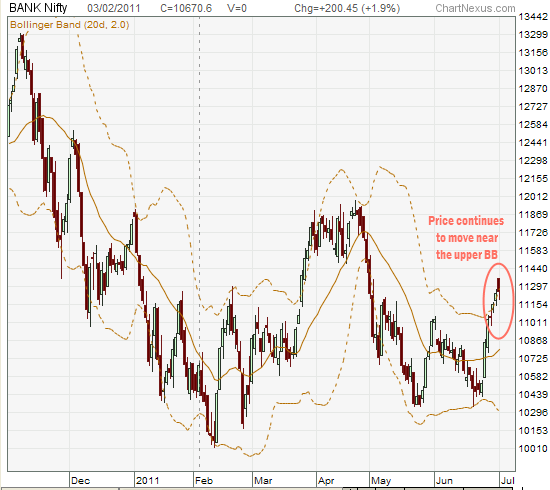
The next real stop is around 12,000, and I think with the Greece situation easing up, this might have been temporary; but when prices talk a different language you have to listen and understand. Watch my twitter feed for quick updates (Either ways I’ll post one in the next Chronicle)
To read further, visit John Bollinger’s web site, and see a one-hour video by him on the band theory. Also read StockCharts’ Excellent Tutorial. What you shouldn’t do is rush to put it in practice. After all, band concepts can only work if you can get confidence, and for that I suggest you paper trade for a few weeks, over a number of different stocks.
Next week, I will publish a set of stocks that have interesting setups for M-Tops and W-Bottoms. Watchhttp://www.marketvision.in for the screens.
The Great Fall of GTL and GTL Infra
Two Stocks – GTL and GTL Infra – have had the worst June in their history. GTL Fell from the 400 levels down to 97 yesterday, and GTL Infra from 32 down to 16. If you consider their highs of 477 and 50 respectively last year, the fall seems even larger. But what triggered the fall?
Two Mondays ago, in what was thought was the fear that the Mauritius treaty would be renegotiated, the GTL stocks fell between 50% and 60% in a single day. GTL was a Ketan Parekh stock in a past life, as in it was pumped up by the manipulator.
Since we forget scams easily, the stock recovered quite a bit and eventually set up GTL Infra as a separately listed company with GTL’s ownership. GTL Infra is a tower company which bought, among another things, Aircel’s 17,500 towers at a value of $1.8 billion. That’s valuing a tower at Rs. 46 lakhs (they can be built for 30 – don’t ask). The companies have an insane amount of debt, with rising interest rates. This might get restructured into equity, which perhaps explains the fall.
More interestingly though, it is amazing that banks have given them 4,000 cr. of debt without much backing it. Staggering as this sounds, consider that 30% of all non-government/non-food bank credit is to “large corporates”. That is about 12.3 lakh crores. Just how much of this is collateralized at all? This could be our “sub-prime” – that if corporates fail to pay debt, and there’s not much collateral backing it, we end up with a serious problem. It’s not very transparent, though, and the current feeling I get is that we all HOPE it’s under control. But the GTL/GTL Infra story shows us how little it takes to change that feeling.
June 2011 Manufacturing PMI Down to 55.3
The HSBC Markit June Manufacturing Purchasing Managers Index (PMI) shows some level of deceleration in growth. It’s fallen to 55.3 from last month’s 57.6, to a nine-month
low.

Above 50 is expansion (growth) and below 50 is contraction. This is a monthly change, seasonally adjusted.
XBRL Levels the Information Field (Introduction)
Extensible Business Reporting Language (XBRL) is the new game in town. It’s just a structured way to describe business data, by which I mean this:
a) People release their financial data in multiple formats
b) For example: What some call revenue, others call it income, yet others call it Total sales.
c) But they all mean the same thing.
d) In such a circumstance, it’s useful to define a single term for whatever means the same thing. If I hear the word revenue I know it means revenue, and not something else.
Read the rest of this entry »
My Interview at BlogAdda
I’ve been interviewed at Blogadda with the flattering headline:
The fuel prices are rising. Inflation is increasing day by day. The Real estate prices have touched the roof. Many of you would be wondering, what are the causes and factors for this? What is the effect of international markets in our day to day life? How do we invest money in the correct way? Keeping all this in mind, we have invited a very special person at your Adda. He is one of the top bloggers from India who blogs on Finance, Market, Economics and much more. We are pleased to welcome Deepak Shenoy at your Adda. Are you ready to understand Indian Finance in a simple way and know more about Deepak and his life? Read on…
There was one question about startups I loved answering, and I’ve realized that applies to pretty much every field:
Read the rest of this entry »
RBI Dy Gov on Analytics and Social Media
Dr. K.C. Chakrabarty, Deputy Governor of the RBI, talked about technology in banking. Specifically, how tech has been used, what will change and the recent initiatives.
Read the rest of this entry »
Creating a Hedge Fund in India: The Structure
In Kaushik Gala’s excellent essay on creating an equity fund structure in India, he touches upon the regulatory problems in creating a fund in India. This essay takes you through different investment fund structures.
Read the rest of this entry »Bank Nifty Trade: Stopped Out But Half Only
In the MarketVision Chronicle, I’d mentioned a Bank Nifty trade with a stop loss of 11,000 (the 50 DMA). The Bank Nifty crossed it yesterday, and I realized that the stop loss was too close – just 1% away from Friday’s close.
Read the rest of this entry »Halonix: A PE run company
This is a “notes” post about a company I was tracking. I now feel the need to use the blog to note down things.
Halonix (earlier Phoenix Lamps) is a lamp manufacturer. They have two divisions, Auto lamps and general lighting (CFL types). In Auto they’re very big and the op is very profitable. General lighting is a loss-leader.
Actis wanted to sell the auto lamp business, but no one cared about the gen-lighting biz, and Actis proposed they would actually buy out the loss making General lighting unit and sell the rest. Philips was interested in paying Rs. 300 cr. which is a darn good deal because the company’s market cap at that time was about 220 cr. (2.8 cr. shares, Rs. 80 or so per share).
Read the rest of this entry »HDFC To Repay 2,000 Cr. for HDFCBank Shares
In 2009, HDFC borrowed about 4,000 cr. in two and three year NCDs, of which they will pay back 2,000 cr. in August 2011. This will need to be rolled over, since the money was used to buy HDFC Bank shares at Rs. 1,520 each. (About 2.36 cr. shares)
The investment was a good one – shares of HDFC Bank are at Rs. 2,400 today. But HDFC isn’t about to dilute it’s stake, so the market value is irrelevant; the issue is about how much they pay to service the debt taken to own this stake.
Already, they’ve paid more than 600 cr. (interest on the whole amount for two years). They’ve received about Rs. 28.5 per share in dividends, which is around Rs. 67 cr., in the last two years. (For the shares bought only with this borrowing) Net-net, they paid out Rs. 550 cr. .
Of course, they gained, over Rs. 2,000 cr. from the share price increase, so in that context it continues to be a good deal; but the break-even point for those shares has gone up from the initial 1,520 to about 1,800 today.
Read the rest of this entry »ELSS Mutual Funds: Early Withdrawal?
FundsIndia posted in it’s twitter account, that Value Research suggested no-lock-ins for ELSS fund savings if you didn’t try to save tax:
If you had not invested in the tax planning funds to save tax, the three-year lock-in does not apply which is mandatory for only those seeking tax deductions by investing in these funds. You can redeem your investments in these two funds whenever you wish.
This is not true. I tried to redeem certain tax-saving funds ahead of time but the application was rejected.
Read the rest of this entry »Off-Topic: Good, Random Stuff
So Google decided finally that I was being a space hog and that I had reached 95% of whatever limit they had, so against the order of the Great Google Mail Advert (You will never have to delete mail!) I now have to delete mail.
Over the last six years I have stored random pieces of mail which are now otherwise available. So I’m going to go ahead and put them in a big post. Off-topic, and nothing much financial. Note: There are dirty words in there. If you can’t handle it, don’t read any further. It’s also going to be very politically incorrect. Please wash your eyes with soap afterwards.
Read the rest of this entry »
Editor’s Picks
A set of links chosen just for you (Visit our Picks section for a regular update)
India is losing the market for trading the Indian rupee
The recent order by the Competition Commission of India on NSE and MCX-SX has a bunch of difficulties based on a lack of understanding of new age industries where a pricing of zero is quite feasible and important, a focus on protecting a competitor instead of upholding competition, etc. I wrote about this in the previous blog post.
The most important problem with this order is that it represents a diversion away from the real story. The real story is that trading in the Indian rupee is leaving India.Wadhwa Says Technology ‘Bubble’ to Burst – Video – Bloomberg
Vivek Wadhwa, director of research at Duke University and a columnist for Bloomberg Businessweek, talks about the valuation of technology companies. Wadhwa also discusses Zynga Inc. and Groupon Inc., initial public offerings by technology companies and secondary markets. (author unknown)
Rs 20,000 crore deposits and land bank the size of Bangalore: Realtor PACL’s illegal schemes may drown millions; The Economic Times
ET spent six weeks to piece together the picture of a co that looks suspiciously like a pyramid scheme and whose downfall could wipe out savings of millions.
Corporate bonds turn extremely attractive for retail investors – Moneylife
If you want to invest Rs10 lakh and above in a fixed-income product, consider listed corporate bonds. Some safe ones can yield returns as high as 12%
Kerala gets tough with money swindlers and MLM companies – Moneylife
Kerala, said to be the country’s most literate state, is flooded with numerous ‘get-rich-quick’ or ‘earn-huge-return’ schemes offered by money swindlers. While the state director general of police has admitted noticing frauds amounting to over Rs1,000 crore, the worrying factor is that even a few policemen have been found to be involved in these MLM schemes
Petro timidness drowns oil companies in red ink
Dallying on price revision, lack of cash for subsidy has IOC, HPCL and BPCL looking at quarterly losses close to Rs 50,000 crore.
When a bank becomes too cooperative
Maharashtra State Cooperative Bank’s woes are due to its attempt to appease its political masters.
Videos
Past Short Takes:
- Reviewing a ULIP: HDFC SL Crest
- Monthly Income Plans
- Conversations: Manish Jain on What’s Good About ULIPs
- What is VWAP?
- Liquid and Ultra Short Term Mutual Funds
- Five Stocks in Five Minutes: April 13, 2011
- DLF – After the Rise
- What is Short Delivery?
- Conversations – Manish Jain: Tech, Advisors and Mega Deals
- What does 40% dividend mean?
- Open and Closed Ended Mutual Funds.
- Conversations with Ramki: DLF, Tata Steel and BankNifty
- Equity Mutual Funds.
- Did FIIs cause the crash?
- Mutual Funds: Pricing and NAV
- Dividend Versus Growth Plans
- Introduction to Mutual Funds in India
- Recovering From a Steep Loss is Tougher
- A primer on the P/E Ratio
- What are Bond Yields?
- The Physical Gold Con Job
- Mutual Funds Are Not Just For Equity Investing
- No More Third Party Cheques for Mutual Funds
- STT and Option Prices